Tableau Developer Marisol Buenaventura
Tableau Developer
[email protected] | (612) 555-1810 | Minneapolis, United States
Profile
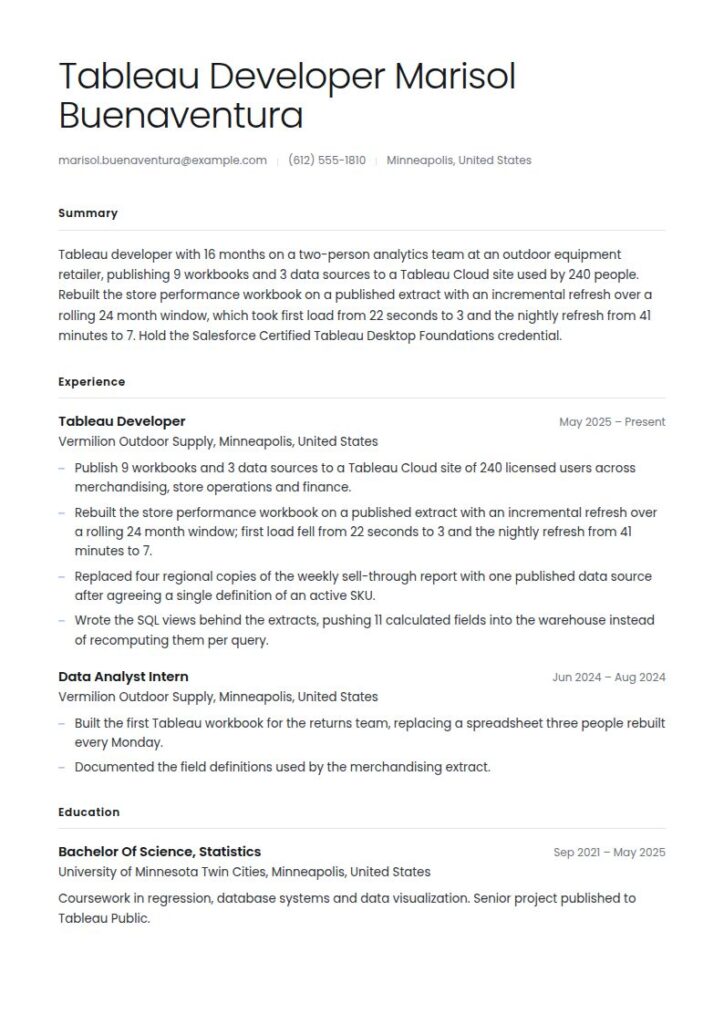
Tableau developer with 16 months on a two-person analytics team at an outdoor equipment retailer, publishing 9 workbooks and 3 data sources to a Tableau Cloud site used by 240 people. Rebuilt the store performance workbook on a published extract with an incremental refresh over a rolling 24 month window, which took first load from 22 seconds to 3 and the nightly refresh from 41 minutes to 7. Hold the Salesforce Certified Tableau Desktop Foundations credential.
Work Experience
05/2025 - Present, Tableau Developer, Vermilion Outdoor Supply, Minneapolis, United States
- Publish 9 workbooks and 3 data sources to a Tableau Cloud site of 240 licensed users across merchandising, store operations and finance.
- Rebuilt the store performance workbook on a published extract with an incremental refresh over a rolling 24 month window; first load fell from 22 seconds to 3 and the nightly refresh from 41 minutes to 7.
- Replaced four regional copies of the weekly sell-through report with one published data source after agreeing a single definition of an active SKU.
- Wrote the SQL views behind the extracts, pushing 11 calculated fields into the warehouse instead of recomputing them per query.
06/2024 - 08/2024, Data Analyst Intern, Vermilion Outdoor Supply, Minneapolis, United States
- Built the first Tableau workbook for the returns team, replacing a spreadsheet three people rebuilt every Monday.
- Documented the field definitions used by the merchandising extract.
Education
09/2021 - 05/2025, Bachelor of Science, Statistics, University of Minnesota Twin Cities, Minneapolis, United States
Coursework in regression, database systems and data visualization. Senior project published to Tableau Public.
Skills
Tableau Desktop, 75
Published data sources and extracts, 65
Incremental refresh, 60
SQL and window functions, 70
Level of detail expressions, 60
Tableau Cloud site publishing, 65
Dimensional modeling, 55
Languages
English, native
Spanish, native
Certificates
03/2025, Salesforce Certified Tableau Desktop Foundations, Tableau
Foundational credential covering core Tableau product knowledge.
Summary
A Tableau developer resume is a one to two page document naming the workbooks and published data sources you own, the Tableau Cloud or Server site they live on, whether they run on extracts or live connections, and how long a view takes to open. This guide gives you three adaptable versions, the publishing block almost nobody writes, the credential names Tableau currently uses, and current Bureau of Labor Statistics pay for the published occupations this work sits in.
Tableau Developer resume examples by experience level
A Tableau developer resume is a one to two page document naming the workbooks and published data sources you own, the site they live on, how they connect to data, and how long a view takes to open for the people who use it.
However, almost every resume for this title says the same four things: dashboards built, stakeholders served, data visualized, insights delivered. None of those can be checked. By contrast, a hiring manager who runs a Tableau site can verify every fact in the paragraph above in about ninety seconds, which is why the file that states them plainly gets a screen.
Resume guide for a Tableau developer resume
In short, this guide and the corresponding Tableau developer resume example will cover:
- How to write a Tableau developer resume, section by section
- Why what you published matters more than what it looked like
- Three adaptable summaries: first Tableau role, working developer and site lead
- The credential names Tableau uses now, and why the old ones date a file
- What the market pays when the Handbook publishes no profile under this title
How to write a Tableau developer resume
First, plan six sections: contact header with a title line, summary, platform and data skills, experience, a publishing block, and education with certifications. Keep one page for your first three or four years, then two once other people build on data sources you own.
The order follows the question the reader is actually answering. After all, it is not "can this person make a chart". Instead, it is "can this person be given a site, and will it still be fast and correct in a year".
| Section | What it is answering | Where it goes |
|---|---|---|
| Title line | Workbook author, or owner of a published data source? | Directly under your name |
| Summary | How many objects, on what site, refreshing how fast, for how many people? | Three or four lines |
| Skills | Which parts of the platform did you own, and which did you only use? | Grouped, under the summary |
| Experience | What did each workbook replace, and what changed? | Reverse chronological, with numbers |
| Publishing block | Can this person be trusted with a data source other teams depend on? | Its own block |
| Certifications | Which Tableau credential, under the name the issuer uses now? | With education |
Open your site and write down five numbers before you write a line
Sign in to the site you publish to and collect five figures: workbooks you own, published data sources you own, the longest extract refresh, distinct people who opened one of your views last month, and how many seconds the heaviest view takes to load.
Nobody produces those from memory, which is the point. Every applicant can claim dashboards. The one who writes "31 workbooks, 14 published data sources, 1,900 licensed users, 4 second median load" has said something that could only come from doing the job.
Run the finished file through the ATS resume checker before you submit. Analytics postings draw heavy volume and are parsed into a structured record first.
Choosing the best resume format for a Tableau developer resume
For that reason, use reverse chronological, single column, platform and data skills near the top. However, move to two pages only once you have owned certified data sources or administered a site.
The functional format tempts people whose title said analyst while the work was data engineering and site administration. It fails anyway, because the reader is checking continuity of ownership: which site, for how long, how many objects, and what happened when a source system changed underneath them. Also, if the title understated the work, fix the title line rather than the format: "Reporting Analyst (Tableau publishing and site permissions)".
Include your contact information
| ✅ Right | ❌ Wrong |
|---|---|
| Marisol Buenaventura | Marisol Buenaventura |
| Tableau Developer, health benefits, 31 workbooks, 14 published data sources | Data Visualization Specialist |
| Salesforce Certified Tableau Data Analyst | Tableau certified |
| (612) 555-1810, [email protected], Minneapolis, MN | (612) 555-1810, [email protected] |
For example, the right column gives a sector, an object count and the credential under the name the issuer prints. The wrong column gives a self-description four hundred other applicants also wrote.
Make use of a summary
Then write three or four lines: what you own, where it lives, one number about speed or adoption, and the credential.
Tableau developer with 16 months on a two-person analytics team at an outdoor equipment retailer, publishing 9 workbooks and 3 data sources to a Tableau Cloud site used by 240 people. Rebuilt the store performance workbook on a published extract with an incremental refresh over a rolling 24 month window, which took first load from 22 seconds to 3 and the nightly refresh from 41 minutes to 7. Hold the Salesforce Certified Tableau Desktop Foundations credential.
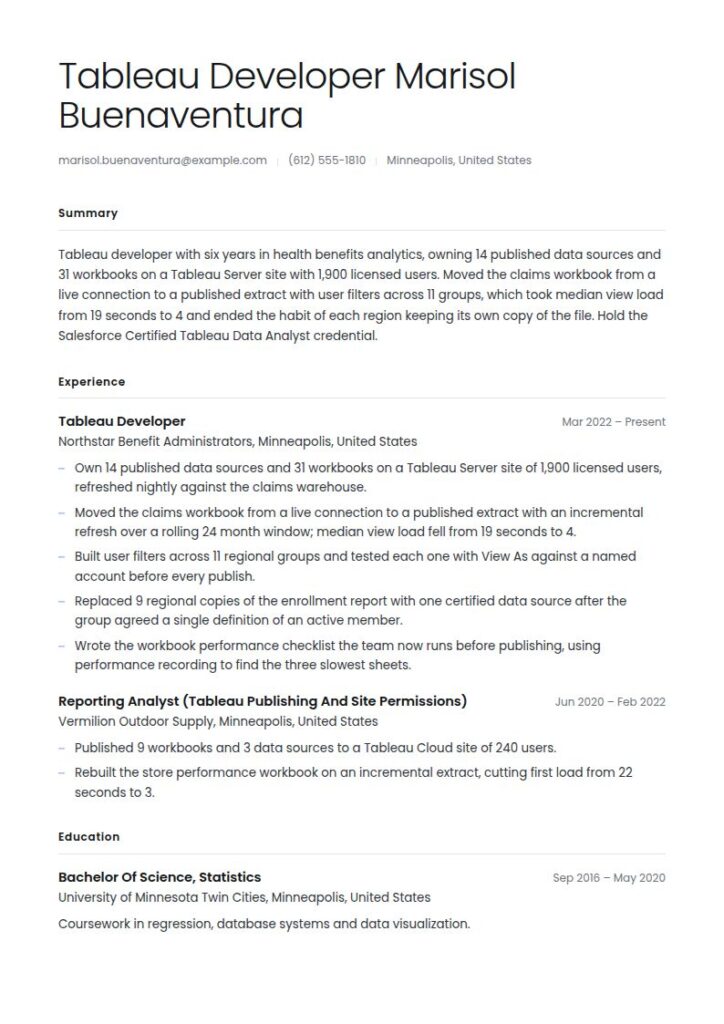
Tableau developer with six years in health benefits analytics, owning 14 published data sources and 31 workbooks on a Tableau Server site with 1,900 licensed users. Moved the claims workbook from a live connection to a published extract with user filters across 11 groups, which took median view load from 19 seconds to 4 and ended the habit of each region keeping its own copy of the file. Hold the Salesforce Certified Tableau Data Analyst credential.
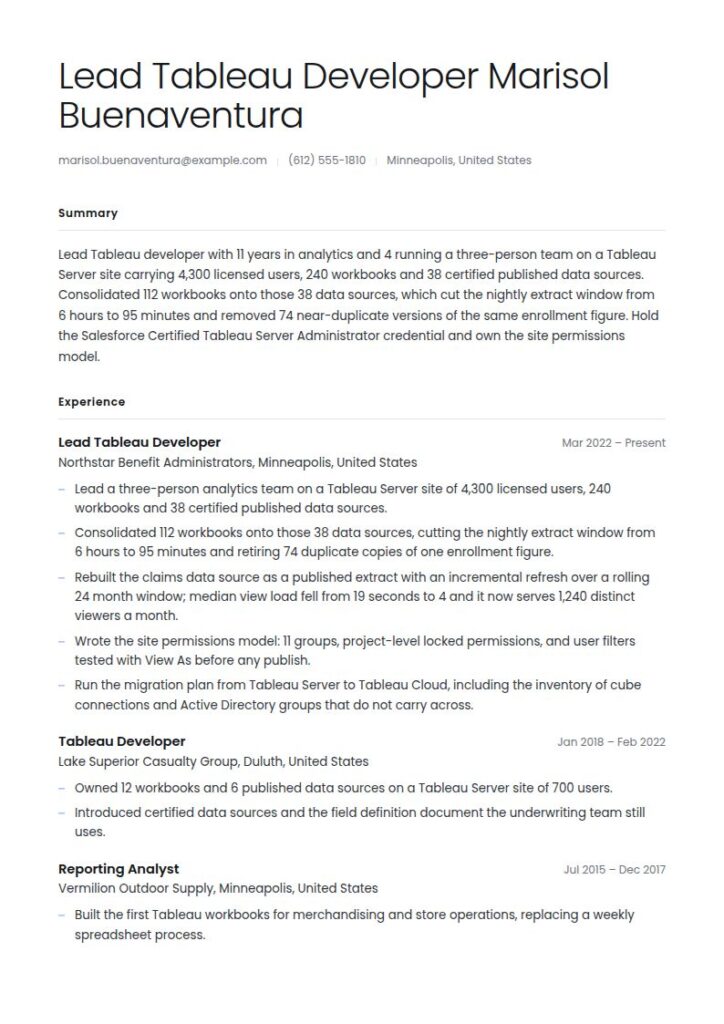
Lead Tableau developer with 11 years in analytics and 4 running a three-person team on a Tableau Server site carrying 4,300 licensed users, 240 workbooks and 38 certified published data sources. Consolidated 112 workbooks onto those 38 data sources, which cut the nightly extract window from 6 hours to 95 minutes and removed 74 near-duplicate versions of the same enrollment figure. Hold the Salesforce Certified Tableau Server Administrator credential and own the site permissions model.
Right vs wrong: the same Tableau developer summary, twice
| ✅ Right | ❌ Wrong |
|---|---|
| Own 14 published data sources and 31 workbooks on a Server site with 1,900 licensed users. | Built interactive dashboards for business stakeholders across the organization. |
| Median view load went from 19 seconds to 4 after moving the claims workbook to a published extract. | Optimized dashboard performance and improved the user experience. |
| Consolidated 112 workbooks onto 38 data sources and retired 74 duplicate copies. | Delivered actionable insights that supported data-driven decision making. |
As a result, every line in the right column points at an object a reader could open. On the other hand, the wrong column could have been written by someone who has only watched a product demonstration.
Outline your Tableau developer experience
Employer, sector, dates, then the estate before any bullet: how many workbooks, how many data sources, which site, how many users. Additionally, in experience, write three to five bullets each, every one naming an object and carrying a number.
| Instead of | Use |
|---|---|
| Created dashboards for multiple departments | Own 31 workbooks and 14 published data sources on a Server site of 1,900 licensed users |
| Improved dashboard performance | Moved the claims workbook to a published extract with a rolling 24 month incremental refresh; median load fell from 19 seconds to 4 |
| Handled data security in Tableau | Built user filters across 11 regional groups and tested each one with View As before every publish |
Lead Tableau Developer, Northstar Benefit Administrators, Minneapolis, MN, March 2022 to Present
Lead a three-person analytics team on a Tableau Server site of 4,300 licensed users, 240 workbooks and 38 certified published data sources, refreshed nightly against the claims warehouse.
Consolidated 112 workbooks onto 38 published data sources, cutting the nightly extract window from 6 hours to 95 minutes and retiring 74 duplicate copies of one enrollment figure.
Rebuilt the claims workbook on a published extract with an incremental refresh over a rolling 24 month window; median view load fell from 19 seconds to 4 and the workbook now serves 1,240 distinct viewers a month.
Wrote the site permissions model: 11 groups, project-level locked permissions, and user filters tested with View As against an account in each group before any publish.
Run the migration plan from Tableau Server to Tableau Cloud, including the inventory of cube connections and Active Directory groups that do not carry across.
What you published, where it lives, and how fast it loads
In other words, this is the section almost nobody writes, and it separates a Tableau developer from someone who has finished the training videos. Specifically, four facts describe the work, and a reader can check every one on your site.
What you published. A workbook and a published data source are different objects and carry different levels of trust. Anyone can publish a workbook. A data source other people build their own workbooks on is a contract: you own the joins, the field names, the filters and the definition of an active member. Say which you own, how many, and how many are certified.
Where it lives. Tableau's documentation draws the line: Tableau hosts and manages Tableau Cloud and it always runs the latest version, while a Tableau Server deployment is infrastructure the customer runs and upgrades (Tableau Help, retrieved 17 September 2026). The same page lists what differs day to day. Server supports cube data sources and custom connectivity through the Connector SDK; Cloud does not connect to cubes. Server authenticates against Active Directory, Kerberos and LDAP; Cloud requires multi-factor authentication and supports SAML and OpenID Connect but neither Kerberos nor LDAP. Cloud gives you Admin Insights with 90 days of retention, or 365 with Advanced Management; Server gives you the repository directly.
That is the difference between a job where you publish to a platform someone else runs and a job where the platform is yours.
How your Tableau workbooks connect
How it connects. Extract or live is the first real design decision, and Tableau documents what an extract buys you: extracts use the .hyper format, hold very large data sets, generally perform better than a view connected straight to the source, allow features the source does not support, and work offline (Tableau Help, retrieved 17 September 2026). The same documentation separates a full refresh, which replaces all existing content in the extract, from an incremental refresh, which only adds rows since the last one.
Write which you chose and why. "Live connection to the policy system so underwriters see same-day changes" and "extract with incremental refresh over 24 months because the source is a nightly batch anyway" are both answers. "Connected to SQL Server" is not.
Load times and the facts to include
How fast it loads. This is the number your audience experiences and the one almost no applicant gives. Record it before and after. A view that opened in 19 seconds and now opens in 4 is a sentence a hiring manager remembers, because they have one of those in their own site.
| The fact | Why the reader wants it | How to write it |
|---|---|---|
| Objects owned | Workbooks and data sources are different jobs | 31 workbooks, 14 published data sources, 9 certified |
| Site and scale | Tells them whether you operated a platform or published to one | Tableau Server, 1,900 licensed users, two-node cluster |
| Connection type | The design decision everything else follows from | Published extract, .hyper, incremental over 24 months |
| Refresh window | The operational fact a site administrator cares about | Nightly, 95 minutes, down from 6 hours |
| Load time | What the audience actually feels | Median view load 4 seconds, from 19 |
| Row-level access | The part with real consequences if it is wrong | User filters across 11 groups, tested with View As |
| Adoption | Whether anyone uses it | 1,240 distinct viewers a month |
| What it replaced | What the organization stopped doing | Retired 74 duplicate workbooks and 9 regional copies |
Published objects, current site
Claims data source: certified, published extract in .hyper, incremental refresh over a rolling 24 month window, nightly in about 95 minutes. User filters across 11 regional groups covering 4,300 licensed users. Backs 34 workbooks built by three other teams.
Enrollment data source: certified, published extract, refreshed twice daily. Replaced 9 regional copies of the same report after the group agreed one definition of an active member.
Platform: Tableau Server, two-node cluster, project-level locked permissions, migration to Tableau Cloud in progress.
If a workbook was inherited, write inherited. If the platform team ran the cluster, write published to rather than administered. Everything in this block is visible in a ten minute screen share, so nothing in it should be generous.
Build a snapshot of your key Tableau developer skills
Twelve to eighteen entries in four groups, data and publishing before visual design. Also, do not list anything you would not want questioned.
Tableau: Published data sources and certification, extracts and .hyper, incremental refresh, live connections, user filters, Tableau Prep Builder, Tableau Bridge, project permissions
Calculation: Level of detail expressions, table calculations, parameters, context filters, performance recording and workbook optimization
Data: SQL and window functions, dimensional modeling, Snowflake, Amazon Redshift, SQL Server, Python for data preparation
Platform: Tableau Server site administration, Tableau Cloud, Active Directory group sync, tabcmd and the REST API
List your education and certifications
Degree first if you have one, then certifications under the exact name the issuer uses.
Generally, a bachelor's degree is the typical entry-level education on both published Handbook occupations this work sits between, data scientists and computer systems analysts (BLS Occupational Outlook Handbook, retrieved 17 September 2026). Nobody reads the transcript, but the line clears a filter at larger employers.
Write the credential under the name Tableau prints today
Tableau's own certification page lists five credentials, all under Salesforce Certified naming: Salesforce Certified Tableau Desktop Foundations at the foundational level, and Salesforce Certified Tableau Data Analyst, Salesforce Certified Tableau Server Administrator, Salesforce Certified Tableau Consultant and Salesforce Certified Tableau Architect at the advanced level (Tableau, retrieved 17 September 2026).
Use those names. A credential written under a name that no longer appears on the issuer's own page is the kind of small staleness a technical reader notices, and it is free to fix: write the name as the issuer prints it now and give the year you earned it.
The tiering also tells you where to aim. Foundations is the credential for a first reporting job. The administrator and architect credentials map to owning a site, and they are what a posting means when it asks for platform experience rather than reporting experience.
Bachelor of Science, Statistics, University of Minnesota Twin Cities, Minneapolis, MN, 2014
Certifications:
Salesforce Certified Tableau Server Administrator, Tableau, 2024
Salesforce Certified Tableau Data Analyst, Tableau, 2021
SnowPro Core Certification, Snowflake, 2023
Choose the right layout and design
Finally, keep the format plain: single column, 11 point body type, plain headings, no photograph, no skill rating bars. After all, someone in data visualization submitting a resume covered in decorative charts is a joke every analytics manager has seen, and a bar claiming 80 percent on level of detail expressions tells a reader nothing.
Put the portfolio link in the header if you have one; one workbook documented properly is worth more than eight that only look finished.
Separate the workbooks you own from the published data sources. Say whether the site is Tableau Cloud or Tableau Server and how many licensed users it carries. State the connection type and the refresh window. Give load time as a before and after. Say how many people opened your views last month. Write credentials under the name the issuer uses now.
Do not count dashboards without saying what sits underneath them. Do not claim you administered a site the platform team ran. Do not describe an inherited workbook as one you designed. Do not list every chart type; the product ships with them. Do not put a chart on the resume itself.
Tableau developer job market and outlook
The Bureau of Labor Statistics publishes no Occupational Outlook Handbook profile under the title Tableau developer, and none named after any vendor product, so there is no employment count or ten-year projection carrying this job title.
The Handbook classifies by the work rather than the software, so the job sits inside published occupations. Two carry most of it, and which one your file is read as depends on whether you wrote about publishing or about charts.
| Occupation (BLS Handbook) | Median pay, May 2025 | Jobs, 2025 | Outlook, 2025-35 | Projected annual openings |
|---|---|---|---|---|
| Data scientists | $120,230 | 275,600 | 35 percent, +95,400 | About 24,800 |
| Computer systems analysts | $105,850 | 544,400 | 8 percent, +42,900 | About 32,900 |
Source: U.S. Bureau of Labor Statistics, Occupational Outlook Handbook, May 2025 wage data and 2025 to 2035 projections, published 27 August 2026.
The fastest-growing adjacent occupation is also the least like your job title
Data scientists are projected to grow 35 percent between 2025 and 2035, adding 95,400 jobs from a base of 275,600. Computer systems analysts are projected to grow 8 percent over the same decade, adding 42,900 from a much larger base of 544,400, and to produce about 32,900 openings a year against 24,800 for data scientists (BLS Occupational Outlook Handbook, 2025 to 2035 projections). The wider computer and information technology group had a median annual wage of $109,470 in May 2025 (BLS, May 2025).
Read those rows against each other before you decide what to emphasize. The faster-growing occupation pays more and is defined by modeling, not by publishing reports. The larger one produces more openings a year. A Tableau developer who owns data sources, permissions and a refresh schedule has a claim on both; one who lists chart types has a claim on neither.
What salary you can expect as a Tableau developer
Because no Handbook occupation is named after a vendor tool, there is no published median wage for this job title, and a number invented for a title BLS has never defined is not one to carry into a negotiation.
Therefore, negotiate against the published occupation your work matches. For instance, data scientists earned a median of $120,230 in May 2025, the lowest 10 percent under $67,240 and the highest 10 percent over $199,130. Similarly, computer systems analysts earned a median of $105,850, the lowest 10 percent under $67,340 and the highest over $167,710 (BLS, May 2025).
Industry matters as much as title. Among data scientists, publishing, broadcasting and content providers employed 12 percent at a median of $142,240, while insurance carriers employed 10 percent at $108,650 (BLS, May 2025). Two candidates with identical Tableau skills can sit far apart on pay because of the sector they publish into.
Three things in the publishing block move an offer: how many certified data sources other teams build on, whether you administered the site or published to it, and whether you can show load time or a refresh window as a before and after.
Key takeaways for a Tableau developer resume
- To start, name what you published, separating workbooks from published data sources.
- Say whether the site is Tableau Cloud or Tableau Server, and how many licensed users it carries.
- State the connection type and why, since extract or live is the decision everything follows from.
- Give load time and refresh window as a before and after.
- Then give distinct monthly viewers and say what the workbook replaced.
- Finally, write Tableau credentials under the names the issuer currently prints.
- Mark the objects you inherited, since a site tour will show the difference anyway.
Build your Tableau developer resume in 15 minutes with our AI resume builder.
Related information technology resume examples
- Data analyst resume
- Data scientist resume
- Power BI developer resume
- SQL developer resume
- Data engineer resume
- AWS data engineer resume
- Systems analyst resume
- Business intelligence and IT resume
- Web analyst resume
- Machine learning engineer resume
- Python developer resume
- IT manager resume
Pair it with a matching Tableau developer cover letter.
Tableau developer resume questions, answered
How long should a Tableau developer resume be?
One page for your first three or four years. Two once other teams build workbooks on data sources you own, because object counts, site scale, permissions groups and refresh windows do not compress into one line. Three pages is a portfolio, and nobody reads one.
Should I list every chart type I have built?
No. It is the most common filler on these resumes and worth almost nothing, because the product ships with the chart types. Spend that space on published data sources, connection type, refresh windows, permissions and load time.
Which Tableau certification should I take?
Tableau lists Salesforce Certified Tableau Desktop Foundations at the foundational level, and Data Analyst, Server Administrator, Consultant and Architect at the advanced level (Tableau, retrieved 17 September 2026). Foundations fits a first reporting job. Server Administrator or Architect is what a posting is asking for when it wants platform experience rather than reporting experience.
What do I write with no professional Tableau experience yet?
Publish one workbook properly to Tableau Public and describe it the way this guide describes work: the source, the grain, the connection type, the calculations you had to write, and how long the heaviest view takes to load. One workbook documented at that depth beats six that only look finished, because it shows decisions rather than clicks.
Does a Tableau developer need to know SQL?
Yes, and it is usually the difference between the two pay bands. The work that makes a view fast happens before Tableau opens: the shape of the table you connect to, the joins, the grain, and what is calculated in the warehouse instead of per query. Put SQL and dimensional modeling in the first skills group, not the last.