Data Analyst, Retail Reporting Mei-Lin Chao
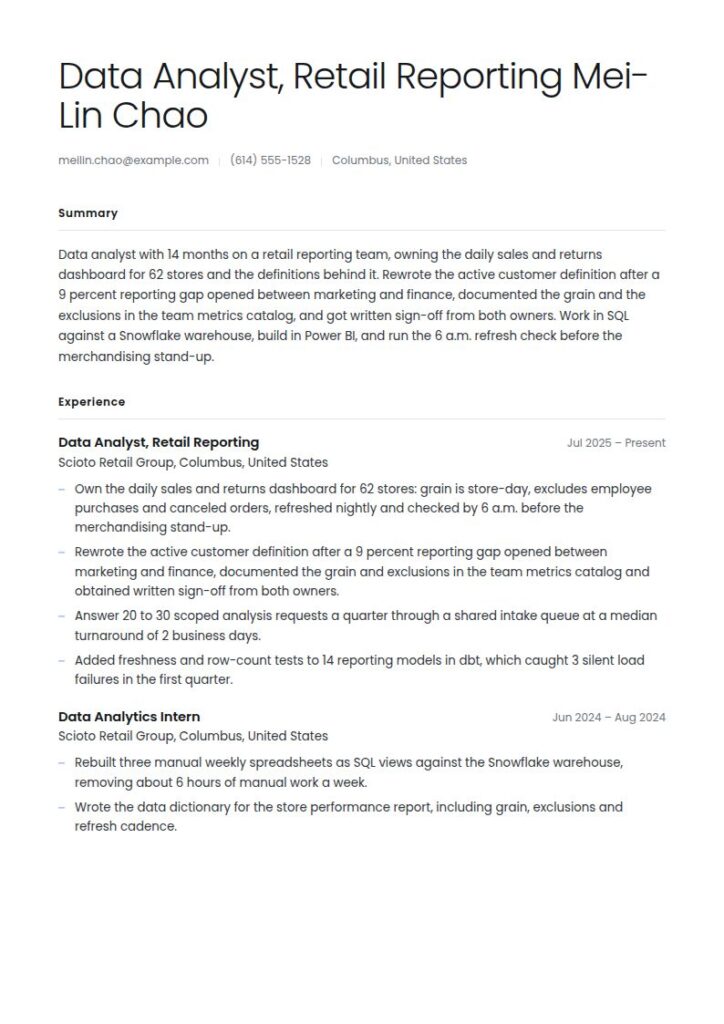
Data Analyst, Retail Reporting
[email protected] | (614) 555-1528 | Columbus, United States
Profile
Data analyst with 14 months on a retail reporting team, owning the daily sales and returns dashboard for 62 stores and the definitions behind it. Rewrote the active customer definition after a 9 percent reporting gap opened between marketing and finance, documented the grain and the exclusions in the team metrics catalog, and got written sign-off from both owners. Work in SQL against a Snowflake warehouse, build in Power BI, and run the 6 a.m. refresh check before the merchandising stand-up.
Work Experience
07/2025 - Present, Data Analyst, Retail Reporting, Scioto Retail Group, Columbus, United States
- Own the daily sales and returns dashboard for 62 stores: grain is store-day, excludes employee purchases and canceled orders, refreshed nightly and checked by 6 a.m. before the merchandising stand-up.
- Rewrote the active customer definition after a 9 percent reporting gap opened between marketing and finance, documented the grain and exclusions in the team metrics catalog and obtained written sign-off from both owners.
- Answer 20 to 30 scoped analysis requests a quarter through a shared intake queue at a median turnaround of 2 business days.
- Added freshness and row-count tests to 14 reporting models in dbt, which caught 3 silent load failures in the first quarter.
06/2024 - 08/2024, Data Analytics Intern, Scioto Retail Group, Columbus, United States
- Rebuilt three manual weekly spreadsheets as SQL views against the Snowflake warehouse, removing about 6 hours of manual work a week.
- Wrote the data dictionary for the store performance report, including grain, exclusions and refresh cadence.
Education
08/2021 - 05/2025, Bachelor of Science, Statistics, minor in Economics, The Ohio State University, Columbus, United States
Coursework in experimental design, regression analysis and survey sampling. Senior project on retail markdown timing, published with data dictionary and code.
Skills
SQL, including window functions, 80
Snowflake, 70
dbt models and tests, 65
Power BI, 80
Excel and Power Query, 85
Metric definitions and data dictionaries, 70
Python (pandas), 60
Languages
English, native
Mandarin Chinese, native
Certificates
09/2025, Microsoft Certified: Power BI Data Analyst Associate, Microsoft
Renewed annually.
02/2026, SnowPro Core Certification, Snowflake
Summary
A data analyst resume is a one to two page document naming the metrics you own, where each definition is written down, who agreed to it, and the decision that changed because of your answer. This guide gives you three adaptable versions, the definition block almost nobody writes, and an honest account of what federal wage data does and does not publish for this title.
Data Analyst resume examples by experience level
A data analyst resume is a one to two page document that names the metrics you own, says where their definitions are written down, and shows what somebody decided differently because of an answer you gave.
In fact, almost every analyst resume in the stack is a tool list: SQL, Python, Tableau, Power BI, Excel, dbt. The hiring manager already has four candidates with that list, and it has never told anyone whether a person can be trusted with a number that goes to a board.
However, what separates the files is a smaller claim: this person owned a definition. In other words, they decided what counted as an active customer, wrote it down, got two departments to agree, and the number stopped moving depending on who ran the query. That is the work. The charts are the packaging.
Resume guide for a data analyst resume
Specifically, this guide and the corresponding data analyst resume example will cover:
- How to write a data analyst resume, block by block
- Why the metrics you own belong on the page as a named list
- Three adaptable summaries: first analyst role, senior analyst and analytics lead
- How to write a definition line that a hiring manager can check
- What the federal wage data publishes for this work, and what it does not
How to write a data analyst resume
Six blocks: contact header, summary, metrics owned, analysis experience, skills and tooling, then education and certifications. Generally, one page for your first three years, two once you own definitions other teams depend on. The metrics block sits directly under the summary, because it is the only part of the page that cannot be copied from a job description.
| Block | What it is answering | Where it goes |
|---|---|---|
| Metrics owned | Which numbers is this person accountable for, and are they written down? | Directly under the summary |
| Analysis experience | What question did they answer, and what changed afterwards? | Reverse chronological, one decision per bullet |
| Skills and tooling | Which warehouse, which modeling layer, which reporting tool? | Grouped, named by product |
| Education and certifications | Do they have the statistical grounding for the claims they make? | Short, near the foot of the page |
Write the question, the answer and the decision, in that order
An analysis bullet with no decision attached is a description of a Tuesday. "Built a customer segmentation model in Python" tells a reader you can run a clustering library, not whether anyone acted on the output.
Write the chain instead: the question somebody asked, the answer you produced, and the decision that changed. "Merchandising asked why clearance margin fell in two categories; the markdown timing analysis showed the first markdown landing 11 days too late, and the clearance calendar moved for spring, cutting markdown spend by $310,000 in the first year."
If you cannot name the decision, the analysis probably was not used, and there is almost always a better bullet in your history that was.
Run the finished file through the ATS resume checker before you send it. Analyst postings draw very large applicant volumes, and the first pass is a parse.
Choosing the best resume format for a data analyst resume
Overall: reverse chronological, single column, one page early and two once you have depth worth the space. Above all, resist the portfolio layout with tiles, sparklines and rating bars. It is tempting for someone who builds dashboards for a living; however, it is the format most likely to come out of a parser as one unreadable string. Instead, keep the visual craft for the work sample and keep the resume plain.
Include your contact information
| ✅ Right | ❌ Wrong |
|---|---|
| Mei-Lin Chao | Mei-Lin Chao |
| Senior Data Analyst, Merchandising and Finance | Data professional with a passion for turning data into insights |
| Owns net revenue, active customer and fulfillment promise attainment in the company metrics catalog | Skilled in SQL, Python, Tableau, Power BI and Excel |
| (614) 555-1528, [email protected], Columbus, OH | (614) 555-1528, [email protected] |
Also, put the business area in the title line. Marketing, finance, supply chain, product, risk and healthcare analytics use different vocabulary, different grains and different systems of record, and a hiring manager is staffing one of them. As a result, "Data Analyst" alone makes the reader guess.
Make use of a summary
In short, four lines: the business area you support, the metrics you own, one definition problem you fixed, and the stack you work in.
Data analyst with 14 months on a retail reporting team, owning the daily sales and returns dashboard for 62 stores and the definitions behind it. Rewrote the active customer definition after a 9 percent reporting gap opened between marketing and finance, documented the grain and the exclusions in the team metrics catalog, and got written sign-off from both owners. Work in SQL against a Snowflake warehouse, build in Power BI, and run the 6 a.m. refresh check before the merchandising stand-up.
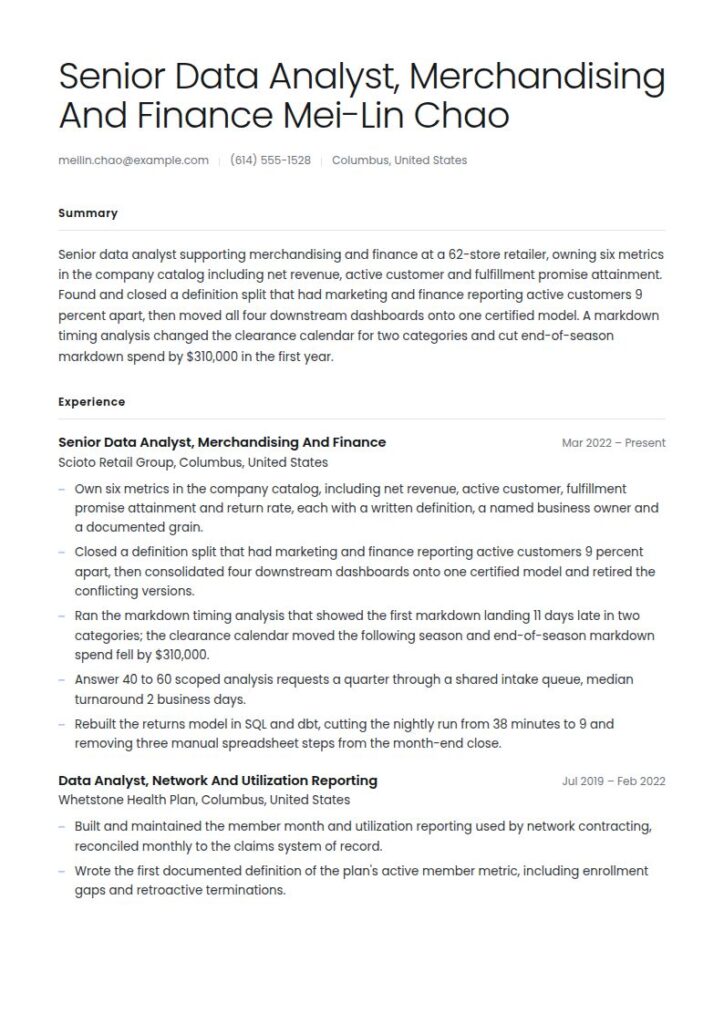
Senior data analyst supporting merchandising and finance at a 62-store retailer, owning six metrics in the company catalog including net revenue, active customer and fulfillment promise attainment. Found and closed a definition split that had marketing and finance reporting active customers 9 percent apart, then moved all four downstream dashboards onto one certified model. A markdown timing analysis changed the clearance calendar for two categories and cut end-of-season markdown spend by $310,000 in the first year.
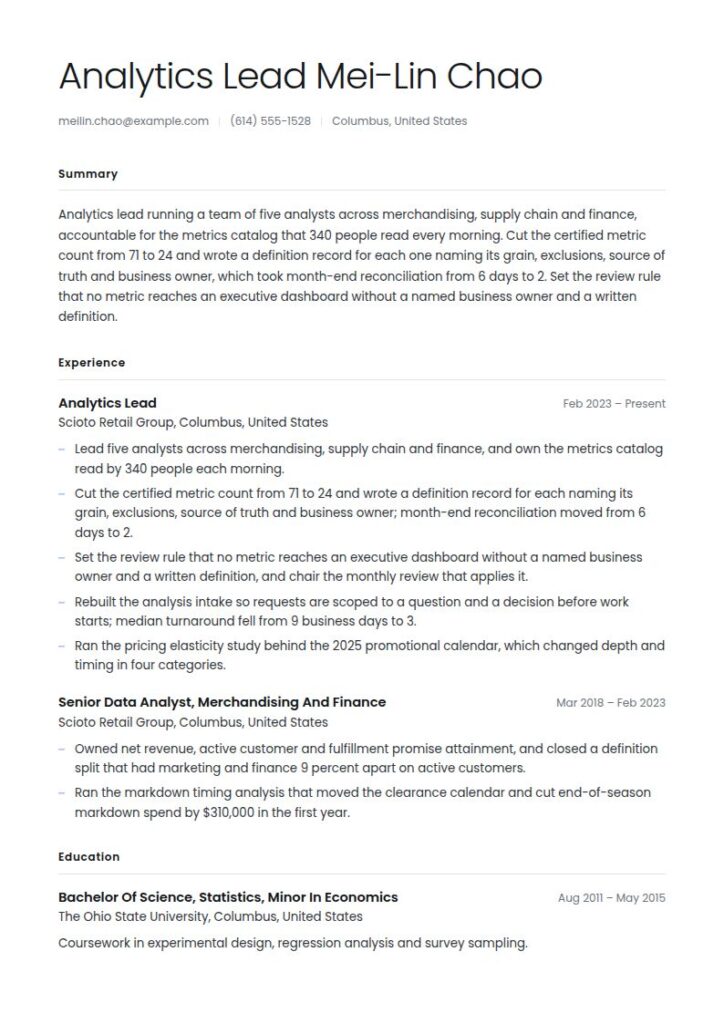
Analytics lead running a team of five analysts across merchandising, supply chain and finance, accountable for the metrics catalog that 340 people read every morning. Cut the certified metric count from 71 to 24 and wrote a definition record for each one naming its grain, exclusions, source of truth and business owner, which took month-end reconciliation from 6 days to 2. Set the review rule that no metric reaches an executive dashboard without a named business owner and a written definition.
Right vs wrong: the same data analyst summary, twice
| ✅ Right | ❌ Wrong |
|---|---|
| Owns six metrics in the company catalog including net revenue and active customer. | Experienced in building reports and dashboards for business stakeholders. |
| Closed a definition split that had marketing and finance 9 percent apart on active customers. | Strong attention to detail and excellent problem-solving skills. |
| A markdown timing analysis moved the clearance calendar and cut markdown spend by $310,000. | Delivered actionable insights that drove business value. |
| Runs the 6 a.m. refresh check before the merchandising stand-up. | Proficient in SQL, Python, Tableau, Power BI and Excel. |
For example, the right column describes a person somebody can hand a number to. The left column, in contrast, describes a person who has used software.
Outline your data analyst experience
Employer, the business area you supported, its size, and the dates. Then three to five bullets, each a question, an answer and a decision.
| Instead of | Use |
|---|---|
| Built dashboards in Tableau for the sales team | Own the regional sales dashboard read daily by 84 store managers: grain is store-day, excludes employee purchases and canceled orders, refreshed at 6 a.m. |
| Performed ad hoc analysis for stakeholders | Answered 40 to 60 scoped requests a quarter with a median turnaround of 2 business days, logged in a shared intake queue |
| Improved data quality across reporting | Rewrote the active customer definition after a 9 percent gap between marketing and finance, then retired the two conflicting versions |
| Used SQL and Python for data analysis | Rebuilt the returns model in SQL and dbt, cutting the nightly run from 38 minutes to 9 and removing three manual spreadsheet steps |
| Presented insights to senior management | Presented the markdown timing analysis to the merchandising committee; the clearance calendar moved for two categories the following season |
Senior Data Analyst, Merchandising and Finance, Scioto Retail Group, Columbus, OH, March 2022 to Present
Own six metrics in the company catalog, including net revenue, active customer, fulfillment promise attainment and return rate, each with a written definition, a named business owner and a documented grain.
Closed a definition split that had marketing and finance reporting active customers 9 percent apart, then consolidated four downstream dashboards onto one certified model and retired the conflicting versions.
Ran the markdown timing analysis that showed the first markdown landing 11 days late in two categories; the clearance calendar moved the following season and end-of-season markdown spend fell by $310,000.
Answer 40 to 60 scoped analysis requests a quarter through a shared intake queue, median turnaround 2 business days.
Rebuilt the returns model in SQL and dbt, cutting the nightly run from 38 minutes to 9 and removing three manual spreadsheet steps from the month-end close.
Name the metrics you own and where their definitions live
This is the block that nobody writes, even though it is the one that makes a hiring manager stop.
After all, an analyst is hired for trustworthy definitions. The chart, on the other hand, is a delivery format and anyone can produce one. Instead, what costs an organization money is two teams reporting the same metric at two different numbers, finding out in a meeting, and spending three weeks establishing which was wrong.
So put the metrics on the page, and the paperwork behind them too. A definition line has six parts.
| Part of the definition | What it settles | Example |
|---|---|---|
| The metric | What it is called, once, everywhere | Active customer |
| The grain | One row is one what | Customer-month |
| The exclusions | What was deliberately left out | Employee accounts, test orders, canceled orders, wholesale |
| The source of truth | Which system wins a disagreement | Order management system, not the marketing platform |
| The refresh | When it is current as of | Nightly, complete by 6 a.m. Eastern |
| The audience | Who acts on it | Merchandising committee, weekly |
Metrics owned, with written definitions in the company catalog:
Net revenue. Grain: order line. Excludes canceled orders, employee purchases and shipping revenue. Source of truth: order management system, reconciled monthly to the general ledger. Refreshed nightly by 6 a.m. Owner of record: finance controller.
Active customer. Grain: customer-month. At least one non-canceled purchase in the trailing 12 months, excluding employee and wholesale accounts. Source of truth: order management system. Refreshed nightly. Agreed jointly by marketing and finance in March 2023 after a 9 percent reporting split.
Fulfillment promise attainment. Grain: shipment. Share of shipments delivered on or before the date promised at checkout, excluding carrier holds. Source of truth: carrier scan data. Refreshed daily. Read by the operations review monthly.
Contributed definitions: return rate, gross margin after markdown, first-purchase conversion.
In particular, three things make that block work on a resume. First of all, it names what broke, and "after a 9 percent reporting split" is the part a hiring manager remembers. It names who agreed, since a definition with no owner is a preference while one signed off by the finance controller is a decision. Finally, it is checkable: grain, exclusions, source of truth and refresh cadence are four facts an interviewer can probe in ninety seconds.
If you own nothing yet, write the block at the scale you have. For instance, one report, its grain, its exclusions, the system it reads from and the team that acts on it. Indeed, owning one small thing completely beats having touched twenty dashboards.
Ambiguous ownership is the obstacle data teams name, and it is the one you can solve on paper
In the 2026 State of Analytics Engineering Report, a survey of 363 data practitioners and leaders published by dbt Labs on 14 April 2026, 41 percent named ambiguous data ownership as an obstacle to their work, and trust in data and data teams as a stated organizational priority rose from 66 percent to 83 percent year over year.
The same survey found 71 percent of data professionals citing incorrect or hallucinated outputs reaching stakeholders as a top concern (dbt Labs, 14 April 2026).
Read those numbers together and the hiring market is legible. Employers are not short of people who can produce a number. They are short of people who can say who owns it, where it is defined and why it should be believed. That is what a metrics block claims.
Build a snapshot of your key data analyst skills
Twelve to sixteen entries in four groups, named by product and warehouse, not by category.
Query and modeling: SQL (window functions, incremental models), dbt, Snowflake, BigQuery, Star schema and slowly changing dimensions, Data contracts and metric definitions
Analysis: Cohort and retention analysis, A/B test design and readout, Time series and seasonality, Regression and elasticity modeling, Sample sizing and confidence intervals, Python (pandas, statsmodels)
Reporting: Power BI, Tableau, Looker, Excel including Power Query, Executive summary writing, Stakeholder intake and request scoping
Governance: Metrics catalog ownership, Definition sign-off process, Data quality testing and freshness checks, Source-to-ledger reconciliation
Name the warehouse, because Snowflake, BigQuery, Redshift and a SQL Server estate are different working weeks and hiring managers screen on it. And keep one governance line in however junior you are, since that is the group almost no competing resume has.
List your education and certifications
Degrees first, then the certifications that map to your stack, then anything showing statistical grounding rather than tool familiarity.
Bachelor of Science, Statistics, minor in Economics, The Ohio State University, Columbus, OH, 2019. Coursework in experimental design, regression analysis and survey sampling.
Certifications: Microsoft Certified: Power BI Data Analyst Associate, Microsoft (2023, renewed annually). dbt Analytics Engineering Certification, dbt Labs (2024). SnowPro Core Certification, Snowflake (2022, renewed 2024).
Selected work: written analysis of retail markdown timing, with method, data dictionary and code, published in a public repository.
Three current certifications that match the posting read as deliberate; eleven, however, read as a substitute for work. If your degree is not quantitative, name the statistics coursework you did take and let the metrics block carry the page.
Choose the right layout and design
Single column, 10 or 11 point, clear headings, no photograph, no rating bars. The metrics block is where a little structure earns its keep: a short labeled list reads well and parses cleanly, while a grid of tiles does neither.
Name the metrics you own with their definitions attached: grain, exclusions, source of truth, refresh cadence. Say who signed off on each one. Write every experience bullet as a question, an answer and a decision. Name the warehouse and the reporting tool by product. Keep one governance line in the skills block even in your first role.
Do not open with a tool list; everyone has the same one. Do not write "actionable insights" or "data-driven decision making". Do not claim a metric you only queried, since owning it means defending the definition. Do not use a dashboard-style template, because it parses badly. Do not quote a percentage improvement without saying what it is a percentage of.
Data analyst job market and outlook
Start with the thing that shapes every salary conversation in this occupation. The U.S. Bureau of Labor Statistics publishes no Occupational Outlook Handbook profile titled "data analyst". The work is real and the postings are everywhere, but the federal statistical system distributes it across several published occupations, which means there is no single official median to quote and this page will not invent one.
What does exist, though, is three published, current profiles that bracket the work. Indeed, almost every job advertised as a data analyst is doing a version of one of them.
| Published occupation, BLS | Median annual wage, May 2025 | Projected change, 2025-35 | Projected annual openings | Jobs, 2025 |
|---|---|---|---|---|
| Data scientists | $120,230 | 35% (much faster than average), +95,400 | About 24,800 | 275,600 |
| Operations research analysts | $88,940 | 12% (much faster than average), +13,500 | About 7,500 | 113,100 |
| Market research analysts | $78,760 | 7%, +66,300 | About 82,000 | 952,700 |
Source: U.S. Bureau of Labor Statistics, Occupational Outlook Handbook, 2025-35 projections and May 2025 wage data.
What the data analyst pay gap means
Read the first column again. The same analytical work, posted under three titles, carries median pay that differs by $41,470. Specifically, data scientists are hired on modeling and production systems; operations research analysts on optimization, simulation and decision modeling, heavily in government and manufacturing; market research analysts on measurement of demand, customers and campaigns, which is where a large share of commercial "data analyst" postings sit.
Even so, none of the three is a lie about what you do. Still, which one your resume reads as is partly a choice, and it is a choice with a number attached.
Similarly, the growth picture is split the same way. Data scientists are projected to grow 35 percent between 2025 and 2035, while market research analysts grow 7 percent on a base nine times larger, producing about 82,000 openings a year against roughly 24,800 (BLS Occupational Outlook Handbook, 2025-35 projections). In short, the fastest-growing title is not the one with the most doors.
What salary you can expect as a data analyst
There is no federal median for this job title, so the honest answer is a band with three anchors in it.
If the posting is measurement, customers, campaigns and market sizing, market research analysts are the reference: median $78,760 as of May 2025 (BLS, May 2025). Moreover, industry medians inside that occupation run from $102,670 in information and $99,850 in management of companies and enterprises, down to $94,330 in finance and insurance, $78,780 in wholesale trade and $77,820 in management consulting (BLS, May 2025).
If the posting is optimization, forecasting, logistics or decision modeling, operations research analysts are the reference: median $88,940 as of May 2025, with federal government at $139,980, manufacturing at $108,120, management of companies at $97,610, professional and technical services at $94,990 and finance and insurance at $80,870 (BLS, May 2025).
If the posting expects you to build and ship models, it is priced as data science: median $120,230 as of May 2025, with publishing, broadcasting and content providers at $142,240, computer systems design at $132,380, credit intermediation at $129,490, management of companies at $128,050 and insurance carriers at $108,650 (BLS, May 2025).
Two conclusions follow. Industry moves pay more than tooling does: the same occupation pays $139,980 in federal operations research against $80,870 in finance and insurance. Therefore, when you negotiate, quote the occupation you actually match with its cycle, because "the BLS May 2025 median for operations research analysts is $88,940" is a sentence a compensation partner can check.
Key takeaways for a data analyst resume
- Above all, lead with the metrics you own, not the tools you have opened.
- Then, give each metric a definition line: grain, exclusions, source of truth, refresh cadence, audience.
- Name what broke before you owned it and who signed off on the fix.
- Write every experience bullet as a question, an answer and a decision.
- Name the warehouse and the reporting tool by product, since that sets your start date.
- Keep one governance line in the skills block even in your first role.
- Know which published occupation your posting matches, because the medians are $41,470 apart.
Build your data analyst resume in 15 minutes with our AI resume builder.
Related information technology resume examples
- Data scientist resume
- Data engineer resume
- SQL developer resume
- Power BI developer resume
- Tableau developer resume
- Web analyst resume
- Systems analyst resume
- Machine learning engineer resume
- AWS data engineer resume
- Python developer resume
- IT resume
- Computer science resume
Pair it with a matching data analyst cover letter.
Data analyst resume questions, answered
How long should a data analyst resume be?
One page for your first three years. Two once you own definitions other teams depend on, lead a review process, or have a body of analyses with decisions attached. The metrics block is usually what justifies the second page.
Why does this page not give a single data analyst salary figure?
Because no current federal one exists. The Bureau of Labor Statistics publishes no Occupational Outlook Handbook profile titled "data analyst", and the retired static wage pages that still circulate belong to an older cycle. This page gives the three published occupations that bracket the work instead: data scientists at $120,230, operations research analysts at $88,940 and market research analysts at $78,760, all May 2025 medians (BLS, May 2025).
What do I put on a data analyst resume with no analyst experience?
One owned thing, described completely. A report you built in a previous job, its grain, what it excluded, which system it read from and who used it. Then a public analysis with the data, the method and the code visible. A candidate who can defend one definition is more hireable than one who lists nine tools.
Should I list SQL, Python and Excel if everyone else does?
List them, but not first and not as the point. Put them in a grouped skills block near the foot of the page, named specifically: SQL with window functions, Python with pandas and statsmodels, Excel with Power Query. The top of the page belongs to the metrics you own.
Do certifications help a data analyst get hired?
Selectively. Two or three current certifications matching the posting's stack, such as a Power BI, Snowflake or dbt credential, read as deliberate and are quick to verify. A long list of short courses reads as a substitute for owned work.
How do I show impact when my analysis did not change anything?
Find a different bullet. Most analysts have more used work than they remember: a report that replaced a manual process, a reconciliation that closed a gap, a metric retired, a query that cut a runtime.