Power BI Developer Kwabena Amankwah
Reporting Analyst (semantic model design and DAX)
[email protected] | (704) 555-1746 | Charlotte, United States
Profile
Power BI developer with 14 months on a two-person reporting team at a wholesale distributor, owning three semantic models behind nine reports for 210 users. Rebuilt the sales model from a flat 41-column import into a star schema with one fact table at order-line grain and five dimensions, which cut the scheduled refresh from 34 minutes to 6 and the published file from 1.2 GB to 240 MB. Hold Microsoft Certified: Power BI Data Analyst Associate (PL-300).
Work Experience
07/2025 - Present, Reporting Analyst (semantic model design and DAX), Steele Creek Supply Company, Charlotte, United States
- Own 3 semantic models behind 9 reports for 210 users across sales, purchasing and warehouse operations.
- Rebuilt the sales model from a flat 41-column extract into a star schema at order-line grain with 5 dimensions; scheduled refresh fell from 34 minutes to 6 and published size from 1.2 GB to 240 MB.
- Wrote 24 measures, including a rolling 12-week fill rate the source system could not produce, and documented each one in the model description field.
- Built 3 row-level security roles so 41 regional sales staff see only their own territory, checked with View As before every publish.
- Replaced a weekly 11-tab spreadsheet with one report; distinct monthly users went from 12 recipients to 188 openers.
06/2024 - 08/2024, Data Analytics Intern, Steele Creek Supply Company, Charlotte, United States
- Profiled 14 source tables in SQL Server and wrote the column dictionary the sales model was later built from.
- Automated 6 recurring Excel exports with Power Query, removing about 5 hours of manual preparation a week.
Education
08/2021 - 05/2025, Bachelor of Science, Information Systems, University of North Carolina at Charlotte, Charlotte, United States
Concentration in business analytics. Capstone: a dimensional model and Power BI report over four years of public transit ridership data.
Skills
Star schema design and fact table grain, 70
Power Query and M, 75
DAX measures and time intelligence, 65
Row-level security, 60
Scheduled refresh and incremental refresh, 65
SQL Server and T-SQL, 70
Power BI Service workspaces, 70
Languages
English, native
Twi, native
Certificates
11/2025, Microsoft Certified: Power BI Data Analyst Associate (PL-300), Microsoft, PL-300
Renewal due within 12 months by free online assessment on Microsoft Learn.
Summary
A Power BI developer resume is a one to two page document describing the semantic models you built rather than the dashboards you decorated. This guide gives you three adaptable versions, the model block that almost no applicant writes, what the PL-300 certification and its renewal rule are worth on the page, and current Bureau of Labor Statistics pay for the published occupations this work sits between.
Power BI Developer resume examples by experience level
A Power BI developer resume is a one to two page document describing the semantic models you built, how they refresh, who can see which rows inside them, and how many people opened the reports on top of them last month.
However, most resumes for this job describe the wrong layer. For example, they list visual types, custom themes, a dashboard count and the word "storytelling". A Power BI resume that lists only visual types is describing the last 10 percent of the work, because the visuals are not where the effort, the cost or the risk lives. The model underneath is.
Resume guide for a Power BI developer resume
In addition, this guide and the corresponding Power BI developer resume example will cover:
- First, how to write a Power BI developer resume, section by section
- Next, why the semantic model belongs on the page and most of the visuals do not
- In addition, three adaptable summaries: first reporting role, working developer and lead
- Finally, what PL-300 is, and why its renewal rule changes how you date the line
- What the market looks like when the Handbook publishes no profile under your title
How to write a Power BI developer resume
Overall, six sections: contact header with a title line, summary, platform and modeling skills, experience, a semantic model block, and education with certifications. As a rule, one page for your first three or four years, two once other teams build reports on models you own.
The order matters because of what the reader is checking. They are deciding whether you are a report author a manager can hand a request, or a model owner a manager can hand a dataset forty other people build on. In other words, those are different levels of trust and different pay bands.
| Section | What it is answering | Where it goes |
|---|---|---|
| Title line | For example, report author, or owner of a shared model? | Directly under your name |
| Summary | Similarly, how many models, at what grain, refreshing how fast, for how many users? | Three or four lines |
| Skills | In addition, which parts of the stack did you own, and which did you only consume? | Grouped, under the summary |
| Experience | Next, what did each model replace, and what changed? | Reverse chronological, with numbers |
| Semantic model block | Above all, can this person be trusted with a dataset other teams depend on? | Its own block |
| Certifications | Is PL-300 current, and when was it last renewed? | With education |
Count your models and your measures before you write a line
Open your workspace and write down four numbers: how many semantic models you own, how many measures are in the largest, how many distinct people opened a report built on it last month, and how long its scheduled refresh takes.
Almost nobody can produce those from memory, which is why they work on a resume. Every applicant can say they built dashboards. One who writes "seven models, 62 measures, 341 monthly users, 9 minute refresh" has said something nobody can say without having done the job.
Run the finished file through the ATS resume checker before you submit. Analytics postings draw heavy volume, and a parser turns each one into a structured record before a person opens it.
Choosing the best resume format for a Power BI developer resume
In general, reverse chronological, single column, modeling and platform skills near the top. As a rule, one page for your first three or four years, two once you have owned certified or shared models across departments.
The functional format tempts people whose titles said analyst while the work was engineering. It fails anyway, because the reader is checking continuity of ownership: which models, for how long, on what capacity, and what happened when a source system changed underneath them. Instead, if the title was wrong, fix the title rather than the format: "Reporting Analyst" that meant model design can be written as "Reporting Analyst (semantic model design and DAX)".
Include your contact information
| ✅ Right | ❌ Wrong |
|---|---|
| Kwabena Amankwah | Kwabena Amankwah |
| Power BI Developer, insurance, 14 semantic models, 730 users | Data Visualization Expert |
| Microsoft Certified: Power BI Data Analyst Associate (PL-300), renewed March 2026 | Power BI certified |
| (704) 555-1746, [email protected], Charlotte, NC | (704) 555-1746, [email protected] |
The right column states a sector, a model count and a user count in one line, then dates the certification so a reader knows it is live. After all, Microsoft role-based certifications lapse if they are not renewed, so an undated "Power BI certified" reads as an expired one.
Make use of a summary
In short, three or four lines: the models you own, the platform under them, one number about refresh or adoption, and the credential.
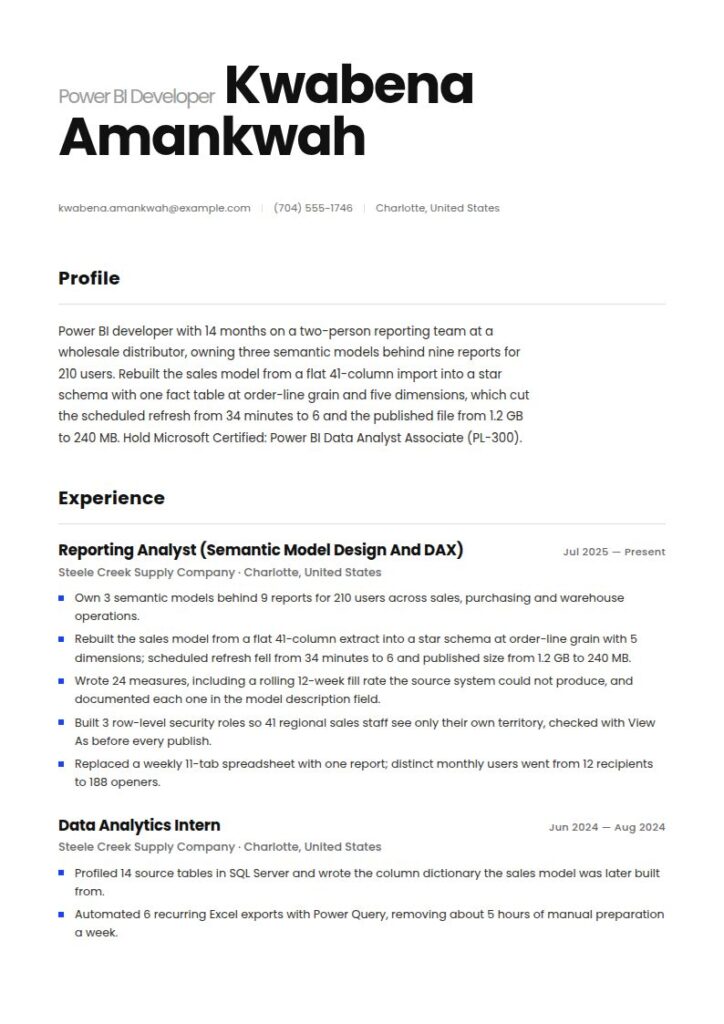
Power BI developer with 14 months on a two-person reporting team at a wholesale distributor, owning three semantic models behind nine reports for 210 users. Rebuilt the sales model from a flat 41-column import into a star schema with one fact table at order-line grain and five dimensions, which cut the scheduled refresh from 34 minutes to 6 and the published file from 1.2 GB to 240 MB. Hold Microsoft Certified: Power BI Data Analyst Associate (PL-300).
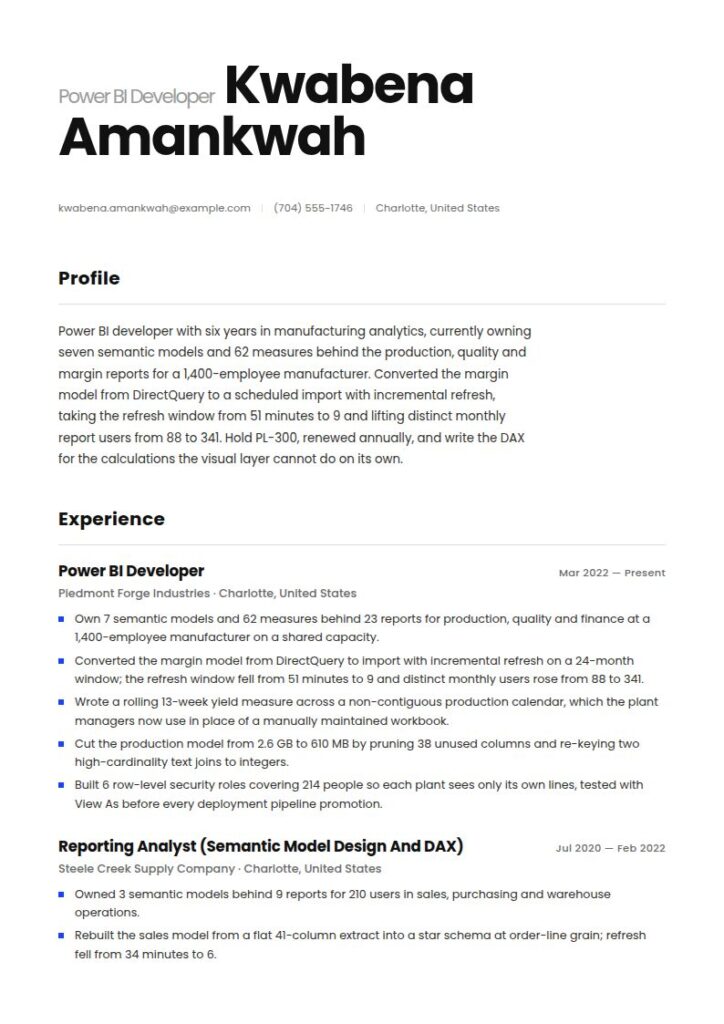
Power BI developer with six years in manufacturing analytics, currently owning seven semantic models and 62 measures behind the production, quality and margin reports for a 1,400-employee manufacturer. Converted the margin model from DirectQuery to a scheduled import with incremental refresh, taking the refresh window from 51 minutes to 9 and lifting distinct monthly report users from 88 to 341. Hold PL-300, renewed annually, and write the DAX for the calculations the visual layer cannot do on its own.
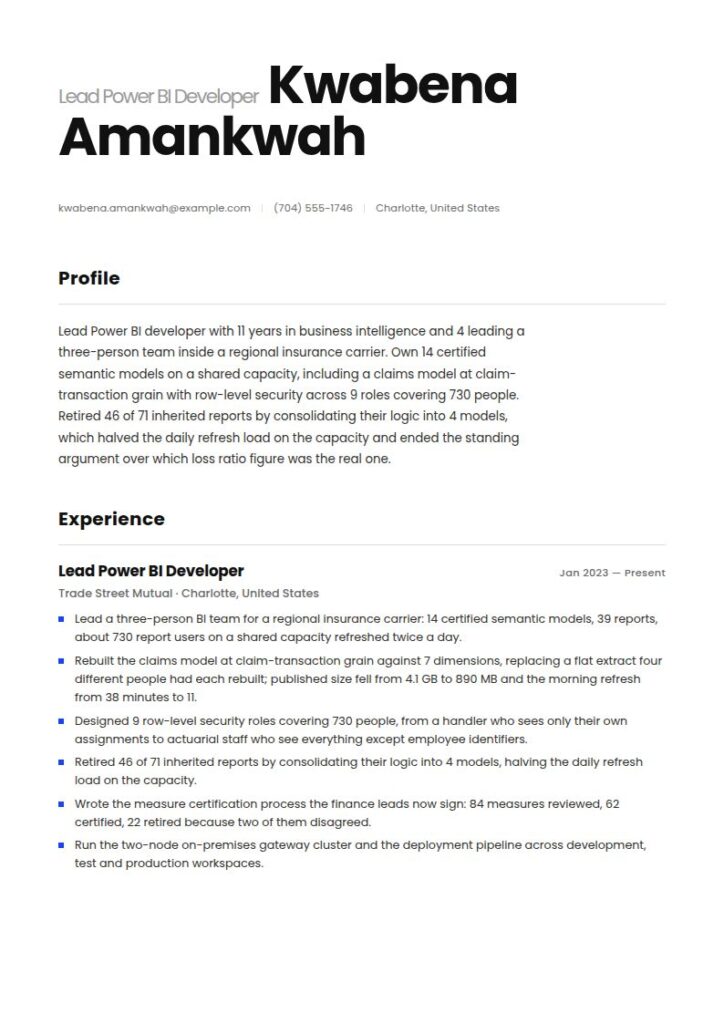
Lead Power BI developer with 11 years in business intelligence and 4 leading a three-person team inside a regional insurance carrier. Own 14 certified semantic models on a shared capacity, including a claims model at claim-transaction grain with row-level security across 9 roles covering 730 people. Retired 46 of 71 inherited reports by consolidating their logic into 4 models, which halved the daily refresh load on the capacity and ended the standing argument over which loss ratio figure was the real one.
Right vs wrong: the same Power BI developer summary, twice
| ✅ Right | ❌ Wrong |
|---|---|
| Own seven semantic models and 62 measures behind the production, quality and margin reports. | Created interactive dashboards and visually engaging reports for stakeholders. |
| Refresh window from 51 minutes to 9 after moving the margin model to incremental refresh. | Improved report performance and optimized data loading. |
| Distinct monthly report users went from 88 to 341 after the model consolidation. | Delivered actionable insights that drove business decisions. |
In contrast, an interviewer can interrogate the right column. Indeed, every line invites a follow-up question the candidate would enjoy answering, which is what a technical screen is for. However, someone who has never opened the tool could have written the wrong column.
Outline your Power BI developer experience
Employer, sector, dates, then the estate before any bullet: how many models, how many reports, how many users, on what capacity. In general, three to five bullets each, every one naming a model or a source system and carrying a number.
| Instead of | Use |
|---|---|
| Created dashboards for various departments | Own 7 semantic models behind 23 reports for production, quality and finance, 1,400 users on a shared capacity |
| Improved report performance | Moved the margin model from DirectQuery to import with incremental refresh; scheduled refresh fell from 51 minutes to 9 |
| Implemented data security | Built 9 row-level security roles so 730 claims staff each see only their own book, tested with View As before every release |
Lead Power BI Developer, Trade Street Mutual, Charlotte, NC, January 2023 to Present
Lead a three-person BI team for a regional insurance carrier: 14 certified semantic models, 39 reports, about 730 report users on a shared capacity refreshed twice a day.
Rebuilt the claims model at claim-transaction grain against seven dimensions, replacing a flat extract four different people had each rebuilt. The published model went from 4.1 GB to 890 MB and the morning refresh from 38 minutes to 11.
Designed 9 row-level security roles covering 730 people, from a handler who sees only their own assignments to actuarial staff who see everything except employee identifiers.
Retired 46 of 71 inherited reports by consolidating their logic into 4 models, halving the daily refresh load on the capacity.
Wrote the measure certification process the finance leads now sign: 84 measures reviewed, 62 certified, 22 retired because two of them disagreed.
Describe the semantic model under the report, not the report
However, this is the section almost nobody writes, and it separates a Power BI developer from someone who has finished the tutorial.
In fact, Microsoft's own certification says where the work sits. For instance, the Power BI Data Analyst Associate credential, exam PL-300, covers four skill groups: prepare the data, model the data, visualize and analyze the data, and manage and secure Power BI (Microsoft Learn, retrieved 16 September 2026). Two of those happen before anyone places a visual on a canvas and a third is governance after the report ships. Therefore, write the resume in the same proportion.
Eight facts that describe a Power BI model
In practice, eight facts describe a model, and a reader can test every one in an interview.
| The fact | Why the reader wants it | Example |
|---|---|---|
| Grain of the fact table | Above all, the first question a modeler asks, and the one that decides everything downstream | One row per claim transaction, not per claim |
| Schema shape, and why | Star schema against a flat import is a design decision, so defend it | Seven dimensions around one fact table, after a 41-column flat extract |
| Measure count, and the few that matter | In practice, sixty measures with four carrying the report is an honest description of any model | 62 measures; loss ratio, earned premium, reserve movement, open claim count |
| DAX for something the visual could not do | In other words, separates writing formulas from solving a problem | Rolling 13-week yield across a non-contiguous production calendar |
| Security roles, and who each covers | The part of the model with real consequences if it is wrong | 9 roles, 730 people, tested with View As before each release |
| Storage mode and refresh duration | For instance, import, DirectQuery, composite and live connection are four different jobs | Import with incremental refresh, twice daily, 11 minutes |
| Model size and what shrank it | In effect, shows you understand compression, cardinality and column pruning | 4.1 GB to 890 MB by pruning 38 columns and re-keying two text joins |
| Capacity or gateway it runs on | Whether you have operated a platform or only published to one | Shared capacity, on-premises gateway cluster of two nodes |
Semantic models owned (current role)
Claims model: one row per claim transaction, 7 dimensions, 62 measures, 41 million rows. Import with incremental refresh on a 36-month window, refreshed 06:00 and 13:00 Eastern in about 11 minutes. Row-level security across 9 roles covering 730 people. Published size 890 MB, from 4.1 GB.
Premium and policy model: one row per policy version, 5 dimensions, 28 measures. Composite, with the policy administration source in DirectQuery for same-day writes and the rest imported.
Agency performance model: one row per agency month, 4 dimensions, 19 measures, certified and shared so the distribution team build their own reports on it.
Platform: shared capacity, two-node on-premises gateway cluster, deployment pipeline across development, test and production workspaces.
Show adoption of your Power BI models
Then give the number almost no applicant gives: adoption. Specifically, how many distinct people opened a report built on your model in a month, and what it replaced. "341 distinct users a month, replacing a 19-tab spreadsheet that three analysts rebuilt every Monday" says what the organization stopped doing; "built an executive dashboard" does not.
Even so, if the model was inherited, say inherited, and if the platform team ran the gateway, write "published to" rather than "administered". As a result, every claim here is checkable in ten minutes of a screen share.
Build a snapshot of your key Power BI developer skills
Overall, twelve to eighteen entries in four groups, modeling group first. Similarly, name products where the name means something, and do not list a technology you would not want questioned for ten minutes.
Modeling: Star schema design, fact table grain, slowly changing dimensions, composite models, aggregations, incremental refresh, model size reduction and column pruning
DAX and query: DAX measures and calculation groups, time intelligence over custom calendars, Power Query and M, query folding, performance analyzer and DAX Studio
Platform and governance: Power BI Service workspaces, deployment pipelines, certified and promoted datasets, row-level security, on-premises data gateway, usage metrics reports
Sources and data: SQL Server and T-SQL, Azure SQL Database, Azure Synapse, Dataverse, REST API sources, flat file ingestion
List your education and certifications
Degree first if you have one, then certifications with the issuing body and the date, then platform work that is not certified but is provable.
For reference, a bachelor's degree is the typical entry-level education on all three published Handbook profiles this job overlaps: data scientists, database administrators and architects, and computer systems analysts (BLS Occupational Outlook Handbook, retrieved 16 September 2026). Nobody will read your transcript, but the line clears a filter at larger employers.
Date PL-300, because it expires unless you renew it
The Microsoft Certified: Power BI Data Analyst Associate credential is earned by passing exam PL-300 and is organized around four skill groups: prepare the data, model the data, visualize and analyze the data, and manage and secure Power BI (Microsoft Learn, retrieved 16 September 2026).
The part applicants get wrong is the end of it. Microsoft role-based certifications expire unless renewed, and the renewal frequency shown for this credential is 12 months, by passing a free online assessment on Microsoft Learn (Microsoft Learn, retrieved 16 September 2026). So write the renewal, not just the award: "Power BI Data Analyst Associate (PL-300), Microsoft, earned 2022, renewed March 2026." A reader who knows the rule treats an undated line as a lapsed one.
Bachelor of Science, Information Systems, University of North Carolina at Charlotte, Charlotte, NC, 2015
Certifications:
Microsoft Certified: Power BI Data Analyst Associate (PL-300), Microsoft, earned June 2022, renewed March 2026
Microsoft Certified: Azure Fundamentals, Microsoft, earned 2021
Choose the right layout and design
In short, single column, 11 point body type, plain headings, no photograph, no skill rating bars. A data visualization professional submitting a resume with decorative charts on it is a joke the reader has seen before, and a bar claiming 80 percent on DAX tells them nothing they can verify.
Put the model count and the user count in the line under your name. State the grain of your main fact table. Give refresh duration as a before and after, with the storage mode named. Name the security roles and how many people they cover. Give distinct monthly users and what the report replaced. Date the PL-300 renewal.
Do not open with a list of visual types, because every applicant has the same list. Do not use "dashboards" as a unit of work without saying what sits underneath them. Do not claim you administered a gateway or a capacity the platform team ran. Do not describe an inherited model as one you designed. Do not put a chart on your resume.
Power BI developer job market and outlook
The Bureau of Labor Statistics publishes no Occupational Outlook Handbook profile under the title Power BI developer, and none named for any vendor tool, so there is no employment count or ten-year projection for this job title.
That is not a gap in the data. The Handbook classifies by the work rather than the software, so this job sits distributed across published occupations, and three of them carry most of it.
| Occupation (BLS Handbook) | Median pay, May 2025 | Jobs, 2025 | Outlook, 2025-35 | Projected annual openings |
|---|---|---|---|---|
| Database administrators and architects | $126,760 | 144,500 | 4 percent, +6,500 | About 7,300 |
| Data scientists | $120,230 | 275,600 | 35 percent, +95,400 | About 24,800 |
| Computer systems analysts | $105,850 | 544,400 | 8 percent, +42,900 | About 32,900 |
Source: U.S. Bureau of Labor Statistics, Occupational Outlook Handbook, May 2025 wage data and 2025 to 2035 projections, published 27 August 2026.
Three published occupations, and your resume decides which one you are read as
The three occupations above carried median annual wages of $126,760, $120,230 and $105,850 in May 2025, with ten-year outlooks of 4 percent, 35 percent and 8 percent through 2035 (BLS Occupational Outlook Handbook, May 2025 wages and 2025 to 2035 projections).
None of the three is named for a tool, so a manager filling one of those seats decides which one your file belongs in using the layer you chose to write about. A resume about visuals reads as report production. A resume about grain, storage mode, security roles and refresh reads as data modeling, which is the work the database administrators and architects profile describes.
That is the practical reason the model block matters: it moves your file from the occupation paying a median of $105,850 toward the one paying $126,760.
Insurance, finance and manufacturing are where large Power BI estates tend to sit, because they carry the transaction volume and the reporting obligations that make a governed model worth paying for. Target those sectors and the model block does more work for you than any other part of the page.
What salary you can expect as a Power BI developer
There is no published median wage for a Power BI developer, because the Handbook does not name occupations after software, and a figure invented for a title BLS has never defined is not one to walk into a negotiation holding.
Therefore, negotiate against the published occupation your work matches. For example, data scientists earned a median of $120,230 in May 2025, the lowest 10 percent under $67,240 and the highest over $199,130. By comparison, computer systems analysts earned $105,850, the lowest 10 percent under $67,340 and the highest over $167,710. Meanwhile, database administrators and architects earned a combined median of $126,760, split into $104,620 for administrators and $139,500 for architects (BLS, May 2025).
Read that last split carefully, because it is the shape of your own career. One published occupation pays one figure for keeping a data platform running and a higher one for designing its structure. A developer who only builds what others request sits on the first side of that line. One who decides the grain, defines the dimensions and owns what other teams build on sits on the second.
Three things in the model block move an offer: the size of the estate you owned, whether you shared or certified your models for other builders, and whether you administered the capacity and gateways or only published to them.
Key takeaways for a Power BI developer resume
- Write the model, not the dashboard; the visuals are the last 10 percent of the job.
- State the grain of your main fact table; it is the first question any modeler asks.
- Give refresh duration as a before and after, with the storage mode named.
- Name the security roles and how many people each one covers.
- Give distinct monthly users and say what the report replaced.
- Date the PL-300 renewal, since the credential expires without one.
- Say what you inherited and what you designed; both are checkable in a screen share.
Build your Power BI developer resume in 15 minutes with our AI resume builder.
Related information technology resume examples
- Data analyst resume
- Data scientist resume
- Tableau developer resume
- SQL developer resume
- Data engineer resume
- AWS data engineer resume
- Systems analyst resume
- Business intelligence and IT resume
- Python developer resume
- Machine learning engineer resume
- Software developer resume
- IT manager resume
Pair it with a matching Power BI developer cover letter.
Power BI developer resume questions, answered
How long should a Power BI developer resume be?
One page for your first three or four years. Two once other teams build reports on models you own, because model count, measure count, capacity, gateways and security roles do not compress into one line. Three pages is a portfolio, and nobody in analytics reads one.
Should I list every visual type and custom visual I have used?
No. It is the most common filler on these resumes and worth almost nothing, because the tool ships with the visuals and any competent user can place them in an afternoon. Spend that space on grain, storage mode, refresh duration and security roles. If a posting names a specific custom visual, add that one line.
Is PL-300 worth taking?
It is the credential most postings for this title name, and one of the few things on an early-career file a reader can verify. Mind the renewal: Microsoft role-based certifications expire unless renewed, and the frequency shown for this one is 12 months, by passing a free online assessment on Microsoft Learn (Microsoft Learn, retrieved 16 September 2026). Put the renewal date on the page.
What do I write with no professional Power BI experience yet?
Build one model properly on a public dataset and describe it the way this guide describes a work model: grain, dimensions, measures, storage mode, refresh and size. One model documented at that depth beats six tutorial dashboards, because it shows decisions rather than clicks. Then add any reporting you did in another job, even in Excel.
How do I prove adoption if my employer does not share usage data?
Ask for the usage metrics report on your own workspace; in most tenants a workspace member can open it. If that is closed to you, count something else: reports retired, the spreadsheet process the model replaced, or the meeting that stopped happening. Name the replacement rather than claiming a number you cannot support.