Business Intelligence Analyst Devendra Iyer
Business Intelligence Analyst
[email protected] | (919) 555-0671 | Raleigh, United States
Profile
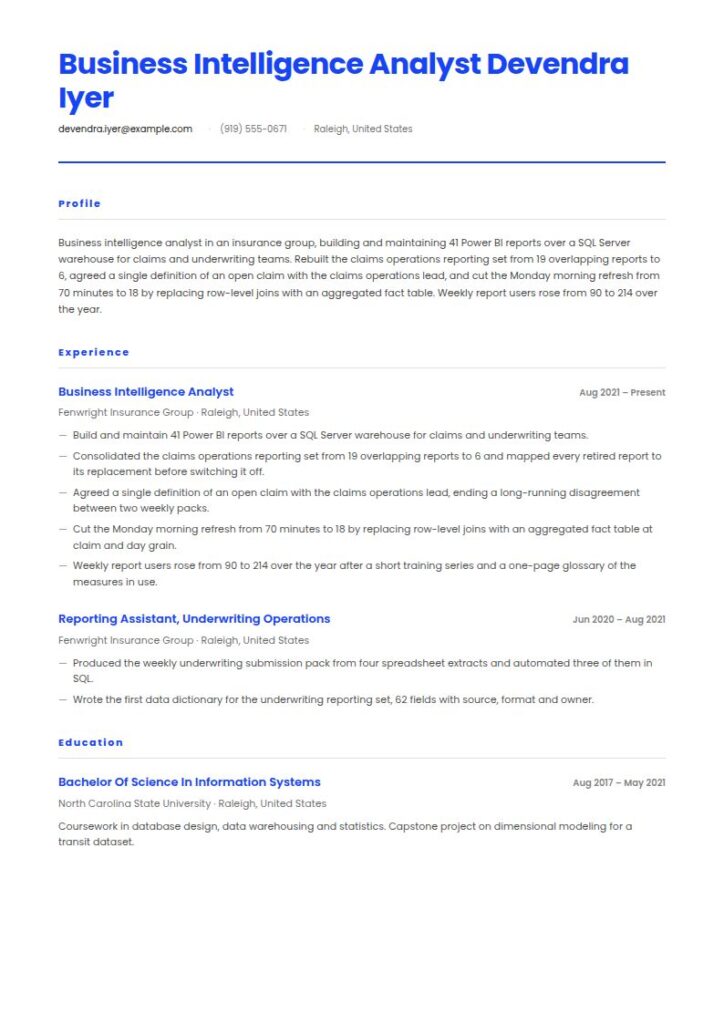
Business intelligence analyst in an insurance group, building and maintaining 41 Power BI reports over a SQL Server warehouse for claims and underwriting teams. Rebuilt the claims operations reporting set from 19 overlapping reports to 6, agreed a single definition of an open claim with the claims operations lead, and cut the Monday morning refresh from 70 minutes to 18 by replacing row-level joins with an aggregated fact table. Weekly report users rose from 90 to 214 over the year.
Work Experience
08/2021 - Present, Business Intelligence Analyst, Fenwright Insurance Group, Raleigh, United States
- Build and maintain 41 Power BI reports over a SQL Server warehouse for claims and underwriting teams.
- Consolidated the claims operations reporting set from 19 overlapping reports to 6 and mapped every retired report to its replacement before switching it off.
- Agreed a single definition of an open claim with the claims operations lead, ending a long-running disagreement between two weekly packs.
- Cut the Monday morning refresh from 70 minutes to 18 by replacing row-level joins with an aggregated fact table at claim and day grain.
- Weekly report users rose from 90 to 214 over the year after a short training series and a one-page glossary of the measures in use.
06/2020 - 08/2021, Reporting Assistant, Underwriting Operations, Fenwright Insurance Group, Raleigh, United States
- Produced the weekly underwriting submission pack from four spreadsheet extracts and automated three of them in SQL.
- Wrote the first data dictionary for the underwriting reporting set, 62 fields with source, format and owner.
Education
08/2017 - 05/2021, Bachelor of Science, Information Systems, North Carolina State University, Raleigh, United States
Coursework in database design, data warehousing and statistics. Capstone project on dimensional modeling for a transit dataset.
Skills
SQL including window functions, 80
Power BI and DAX, 80
Dimensional modeling and star schemas, 65
Report consolidation and deprecation, 70
Metric definition and glossary writing, 70
SQL Server and SSIS, 70
Languages
English, native
Tamil, native
Hindi, intermediate
Certificates
02/2023, Microsoft Certified: Power BI Data Analyst Associate, Microsoft
Examination PL-300.
Summary
A business intelligence resume is a one to two page document about a model and a set of definitions: the tables you built, the metrics you certified, who signs a change to them, and how many people now answer their own questions. This guide gives you three adaptable versions, the governance block that decides these hires, and current Bureau of Labor Statistics pay for the occupations that hold the work.
Business Intelligence resume examples by experience level
A business intelligence resume is a one to two page document about a model and a set of definitions. Not a dashboard count. The tables you built and at what grain, the metrics you certified, who is allowed to change one, and how many people stopped asking you for numbers because they could get them themselves.
Dashboard counts are the commonest mistake on these files, and they are unreadable. Forty dashboards built over three years might be a thriving self-serve platform or a graveyard nobody opens, so a reader discounts the number. What they can read is a model, a definition and a usage figure.
This page is about building the layer. If your work is the analysis on top of it, our business analyst resume example covers requirements and process work instead.
Resume guide for a business intelligence resume
This guide and the corresponding business intelligence resume example will cover:
- How to write a business intelligence resume, block by block
- The pipeline: source system to model to certified metric to dashboard
- Three adaptable summaries: analyst, developer and lead
- Why a certified metric definition beats a dashboard count, and how to write one
- What the job market looks like and what you can expect to earn
How to write a business intelligence resume
Five blocks: contact header, summary, the platform block, employment history, then skills and education. One page for your first three years, two once you own a model other teams build on.
The platform block is the one almost nobody writes, and it is where a hiring manager decides whether to read the rest.
| Block | What it is answering | Where it goes |
|---|---|---|
| Platform | Which warehouse, which transformation tool, which visualization layer? | Header line plus a short block |
| Model | How many models or tables, at what grain, from how many sources? | Under the summary |
| Definitions | How many certified metrics, and who signs a change? | Its own bullets |
| Adoption and cost | Weekly users, self-serve share, refresh times, warehouse spend | One bullet each, with a before and after |
Name the stack by product, and say which layer you owned
"Business intelligence tools" matches nothing in a search and tells a reader nothing. Name the warehouse, the transformation layer, the orchestration, the semantic layer and the visualization tool, and say which of them you owned rather than used.
A person who writes models in dbt against Snowflake, owns the semantic layer and publishes in Power BI is doing three jobs that are hired separately at larger companies. Saying which one you were accountable for is what stops you being read into the narrowest of the three.
Add the scale. A model over 40 million rows refreshed hourly is different work from one over 40,000 rows refreshed nightly, and the row count is a single short clause.
Run the finished file through the ATS resume checker before you submit. Tool names are what these postings filter on, and a two-column template is where a parser loses them.
Choosing the best resume format for a business intelligence resume
Reverse chronological, single column, one page early and two once you own a platform. The progression it shows well is analyst to developer to lead, and it is a real one: an analyst answers questions, a developer builds the model the answers come from, a lead decides what the model is allowed to mean.
Coming from analysis, reporting or data entry, keep the timeline and convert the evidence. Reports rebuilt, extracts retired, manual steps automated and hours of somebody else's week returned are all platform evidence even when your title was not technical.
Include your contact information
| ✅ Right | ❌ Wrong |
|---|---|
| Devendra Iyer | Devendra Iyer |
| Business Intelligence Developer, Snowflake, dbt, Power BI | Data-driven BI professional |
| 118 dbt models, 34 certified metrics, 640 weekly report users | Expert in dashboards, reporting and analytics |
| (919) 555-0671, [email protected], Raleigh, NC | (919) 555-0671, [email protected] |
The third line is the whole argument in eleven words: something built, something governed, and somebody using it.
Make use of a summary
Four lines: the stack and the layer you owned, the model with its scale, the definitions you govern, and one adoption or cost number that moved.
Business intelligence analyst in an insurance group, building and maintaining 41 Power BI reports over a SQL Server warehouse for claims and underwriting teams. Rebuilt the claims operations reporting set from 19 overlapping reports to 6, agreed a single definition of an open claim with the claims operations lead, and cut the Monday morning refresh from 70 minutes to 18 by replacing row-level joins with an aggregated fact table. Weekly report users rose from 90 to 214 over the year.
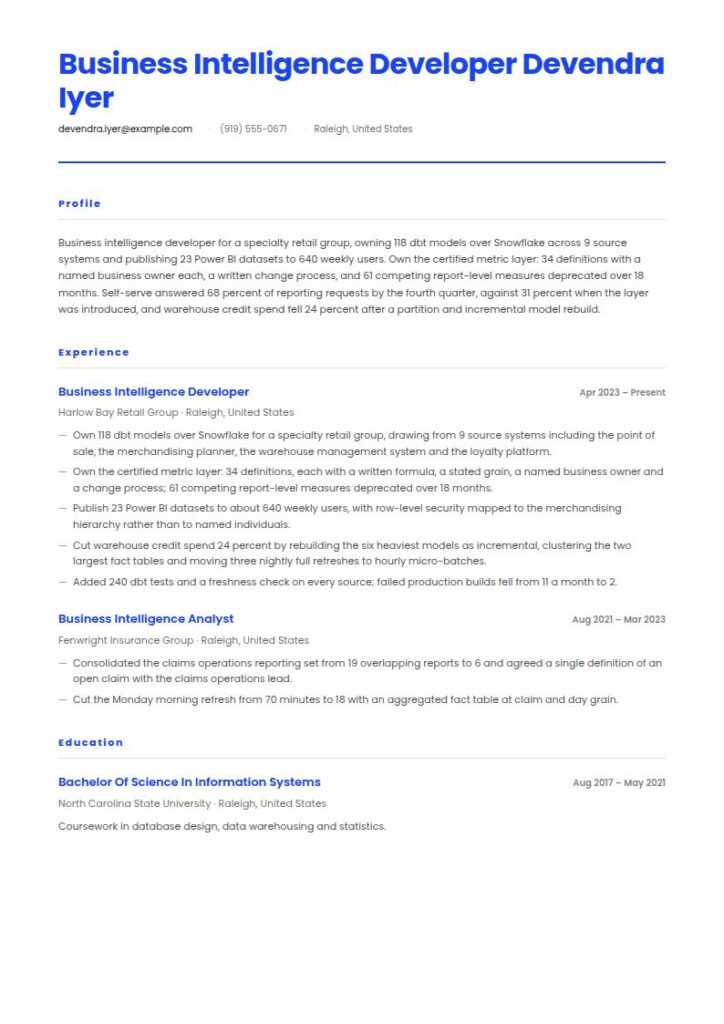
Business intelligence developer for a specialty retail group, owning 118 dbt models over Snowflake across 9 source systems and publishing 23 Power BI datasets to 640 weekly users. Own the certified metric layer: 34 definitions with a named business owner each, a written change process, and 61 competing report-level measures deprecated over 18 months. Self-serve answered 68 percent of reporting requests by the fourth quarter, against 31 percent when the layer was introduced, and warehouse credit spend fell 24 percent after a partition and incremental model rebuild.
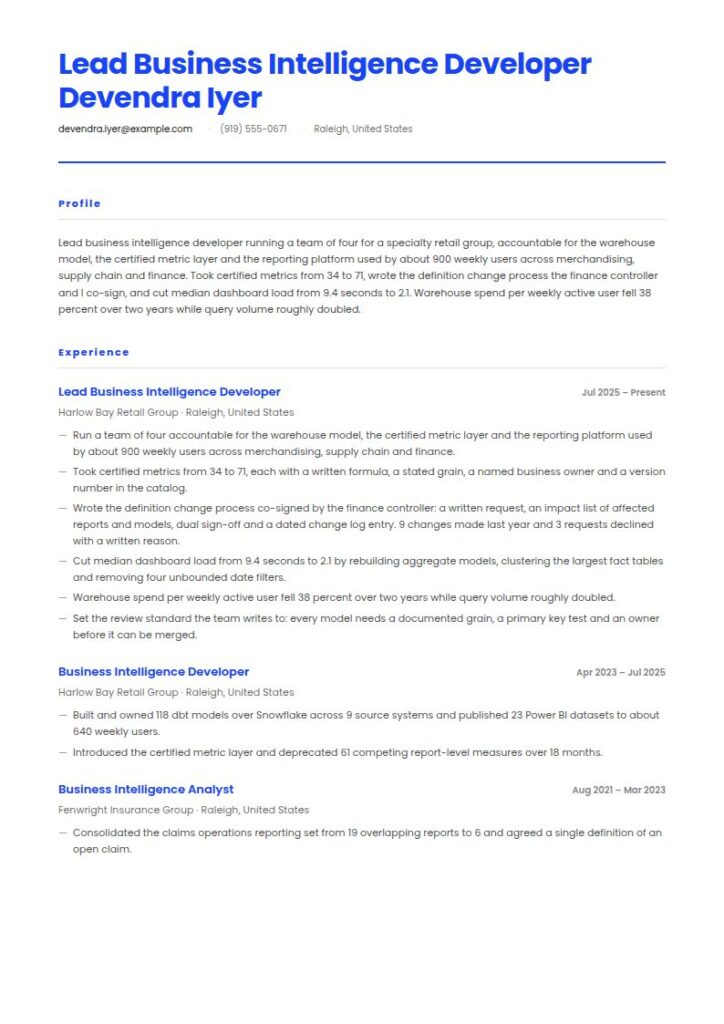
Lead business intelligence developer running a team of four for a specialty retail group, accountable for the warehouse model, the certified metric layer and the reporting platform used by about 900 weekly users across merchandising, supply chain and finance. Took certified metrics from 34 to 71, wrote the definition change process the finance controller and I co-sign, and cut median dashboard load from 9.4 seconds to 2.1. Warehouse spend per weekly active user fell 38 percent over two years while query volume roughly doubled.
Right vs wrong: the same business intelligence summary, twice
| ✅ Right | ❌ Wrong |
|---|---|
| 118 dbt models over Snowflake across 9 source systems. | Built and maintained data pipelines and dashboards. |
| 34 certified metrics, each with a named business owner. | Created reports to support data-driven decision making. |
| 61 competing report-level measures deprecated over 18 months. | Improved data quality and consistency across the business. |
| Self-serve answered 68 percent of requests, against 31 percent. | Empowered stakeholders with self-service analytics. |
Everything in the right column is a number somebody could verify in an afternoon. The left column is what the other forty files say, and none of it distinguishes a platform from a pile of workbooks.
Outline your business intelligence experience
Employer, what the business does, the stack, the scale of the data and the size of the audience. Then four to six bullets, each carrying a model, a definition, an adoption number or a cost.
| Instead of | Use |
|---|---|
| Built dashboards for stakeholders | Publish 23 Power BI datasets over 118 dbt models to 640 weekly users in merchandising, supply chain and finance |
| Improved data quality | Added 240 dbt tests over uniqueness, referential integrity and accepted values; failed builds fell from 11 a month to 2 |
| Standardized reporting across the business | Certified 34 metric definitions with a named business owner each and deprecated 61 competing report-level measures |
| Optimized query performance | Cut median dashboard load from 9.4 seconds to 2.1 by rebuilding six models as incremental and clustering the two largest fact tables |
| Reduced manual reporting effort | Retired 14 spreadsheet extracts, returning about 9 hours a week to the merchandising planning team |
| Supported self-service analytics | Self-serve answered 68 percent of reporting requests by the fourth quarter, against 31 percent before the certified layer existed |
Business Intelligence Developer, Harlow Bay Retail Group, Raleigh, NC, April 2023 to Present
Own 118 dbt models over Snowflake for a specialty retail group, drawing from 9 source systems including the point of sale, the merchandising planner, the warehouse management system and the loyalty platform.
Own the certified metric layer: 34 definitions, each with a named business owner, a written formula, a stated grain and a change process; 61 competing report-level measures deprecated over 18 months.
Publish 23 Power BI datasets to about 640 weekly users, with row-level security mapped to the merchandising hierarchy rather than to individual named users.
Cut warehouse credit spend 24 percent by rebuilding the six heaviest models as incremental, clustering the two largest fact tables and moving three nightly full refreshes to hourly micro-batches.
Added 240 dbt tests and a freshness check on every source; failed production builds fell from 11 a month to 2, and the reporting team now hears about a broken feed before the business does.
Own the metric definition: the certified layer, its owner and its change record
This is the block that separates a business intelligence resume from a reporting resume, and it is missing from nearly all of them.
Building a report is a task. Defining a metric is a decision with consequences: it settles an argument between two teams, it changes what a bonus pays out on, and people quote it in meetings for years. A candidate who has done the second is a different hire.
Certified metrics: 34 definitions in the semantic layer, each with a written formula, a stated grain, a named business owner, a refresh cadence and a version number. Grouped as merchandising, supply chain, customer and finance.
Worked example, net sales: defined as gross sales less returns, discounts and loyalty redemption, excluding tax and shipping, at store, day and product grain. Owner, the finance controller. Two prior competing definitions retired, one of which had excluded loyalty redemption and ran about 3 percent high.
Change process: any change to a certified definition needs a written request, an impact list of the reports and downstream models affected, sign-off from the business owner and from me, and a dated entry in the change log. 9 changes made in the last year, 3 requests declined with a written reason.
Deprecation: 61 competing report-level measures removed over 18 months, each with a 30-day notice to its users and a mapping to the certified equivalent.
Testing: 240 dbt tests over uniqueness, referential integrity, accepted values and row count thresholds, plus a source freshness check on all 9 feeds. Failed production builds down from 11 a month to 2.
Documentation: every certified metric visible in the catalog with its owner, its formula in plain English and its last change date; 78 percent of certified metrics opened at least once a month by someone outside the data team.
Four things make that block credible.
A definition is a sentence, not a formula. Write it the way you would say it to a controller: what is included, what is excluded, and at what grain. A reader who can picture the sentence trusts the number; one who is handed SQL cannot check anything in the time they have.
Somebody outside the data team owns it. A metric owned by the data team is a metric nobody argues with and nobody uses. Naming the business owner is the single strongest line in this block, because it proves the definition survived a conversation with the person whose targets depend on it.
The change log is the artifact. Say how many changes were made, how many requests were declined and what a request has to contain. Declining a change, with a written reason, is the part that reads as governance rather than as a ticket queue.
Deprecation is the work. Anybody can add a certified metric. Removing the sixty-one older ones that disagreed with it, on notice and with a mapping, takes a year and is what actually changes what the company believes.
Ambiguous ownership is the obstacle, not the technology
In its 2026 State of Analytics Engineering report, published 14 April 2026 and based on 363 data practitioners and leaders surveyed in late 2025 and early 2026, dbt Labs found ambiguous data ownership named as a persistent obstacle by 41 percent of respondents, while technical integration problems fell from 35 percent to 27 percent year over year. Trust in data and data teams as an organizational priority rose from 66 percent to 83 percent in the same period, and 71 percent named incorrect or hallucinated outputs reaching stakeholders as a top concern (dbt Labs, April 2026).
That is the argument for writing your resume around definitions rather than tools. The integration problem is getting easier and the ownership problem is not, so the scarce person is the one who can get a finance controller and a merchandising director to agree what a number means and then keep them to it.
The same survey found 57 percent reporting increased warehouse and compute spend against 36 percent reporting increased team budgets (dbt Labs, April 2026). A candidate who can name what their platform costs, and what they did to move it, is answering a question more organizations are asking every year.
Build a snapshot of your key skills
Twelve to sixteen entries in four groups: modeling, the stack, governance and languages. Order them by what you owned, not by what you have seen.
Modeling: Dimensional modeling and star schemas, Slowly changing dimensions, Incremental models, Grain definition, Semantic layer design, Data contracts
Stack: Snowflake, dbt, Airflow, Power BI, Fivetran, Git and pull request review, Azure DevOps
Governance and quality: Certified metric definition, Metric change control, Data catalog and documentation, dbt testing, Source freshness monitoring, Row-level security design
Languages: SQL including window functions and query profiling, Python for orchestration and data quality checks, DAX, Jinja
Separate what you owned from what you worked alongside. Someone who has read pull requests against an orchestration repository should not list the orchestrator beside the warehouse they model in.
List your education and certifications
Degree, then the platform certifications, then anything about the business domain. Keep it to five lines.
Bachelor of Science, Information Systems, North Carolina State University, Raleigh, NC, 2021
Microsoft Certified: Power BI Data Analyst Associate, Microsoft, 2023
SnowPro Core Certification, Snowflake, 2024
dbt Analytics Engineering Certification, dbt Labs, 2025
Domain training: retail merchandising fundamentals, 2024. Inventory and cost accounting for reporting, 2025.
The domain line does more work than it looks. A developer who understands how a retailer accounts for markdowns writes a definition a controller will sign. One who does not writes a formula that is technically correct and commercially wrong.
Choose the right layout and design
Single column, 10 or 11 point, real text for tool names, no graphics and no skill bars. A chart of your own competence on a business intelligence resume reads badly for obvious reasons.
Name the warehouse, transformation, orchestration, semantic and visualization layers separately. Give model counts with the source count and the row scale. Write one certified definition in full. Name the business owner of a metric. Report weekly active users and the self-serve share. Give a before and after for refresh time and for cost. Say how many measures you deprecated.
Do not lead with a dashboard count. Do not list a tool you have only read about. Do not put company data, customer records or a real revenue figure in a portfolio screenshot. Do not claim ownership of a model you contributed to; "contributed 19 of the 118 models" is a strong line. Do not describe adoption without a denominator. Do not quote a performance improvement without saying what you changed.
One more rule, and it costs people offers. Portfolio screenshots of dashboards built at work are your employer's data. Rebuild the example on a public dataset before you show it, and say so.
Business intelligence job market and outlook
The Bureau of Labor Statistics publishes no Occupational Outlook Handbook profile for business intelligence, and no single published profile matches the field. The Handbook covers broad occupations rather than job titles, and this work is split across several of them depending on which half of the job you do.
The honest reading is to bracket. Modeling and analytics work is counted with data scientists, whom the Handbook describes as people who "use analytical tools and techniques to extract meaningful insights from data". Platform design sits with database administrators and architects, where architects "design and build new databases for systems and applications". Requirements-facing reporting roles are counted with computer systems analysts, and titles that fit none of these fall into business operations specialists, all other.
| Bracketing occupation | Employment, 2025 | Projected change, 2025 to 2035 | Annual openings | Median annual wage, May 2025 |
|---|---|---|---|---|
| Data scientists | 275,600 | 35 percent, +95,400 | About 24,800 | $120,230 |
| Database administrators and architects | 144,500 | 4 percent, +6,500 | About 7,300 | $126,760 |
| Computer systems analysts | 544,400 | 8 percent, +42,900 | About 32,900 | $105,850 |
| Business operations specialists, all other | 1,157,600 | 4 percent | Not published | $83,050 |
Source: U.S. Bureau of Labor Statistics, Occupational Outlook Handbook, May 2025 wage data and 2025 to 2035 projections. The last row is from the Handbook's Data for Occupations Not Covered in Detail page, which publishes employment, projected employment, percent change and the median wage but no annual openings and no wage percentiles.
One bracket is growing 35 percent and one is flat
Data scientists numbered 275,600 in 2025 and are projected to reach 371,000 by 2035, a rise of 95,400 jobs and 35 percent, which the Handbook calls much faster than the average for all occupations, with about 24,800 openings a year and a median annual wage of $120,230 in May 2025 (BLS Occupational Outlook Handbook, May 2025 and 2025 to 2035 projections). The Handbook attributes the growth to "an increased demand for data-driven decisions".
Database administrators and architects move in two directions inside one profile: administrators are projected at 0 percent over the decade with a May 2025 median of $104,620, architects at 9 percent with a median of $139,500 (BLS, May 2025). Administration is flat and design is growing.
So write the design half of what you do, not the maintenance half. A file about keeping reports running sits in the flat column. A file about building the model, defining what it means and retiring what disagreed with it sits in the growing ones, and it is the same work seen from the end that pays.
What salary you can expect in business intelligence
There is no published median for the title, so the range has to be bracketed rather than quoted, which is roughly what a compensation team does anyway.
The four occupations above ran from a May 2025 median of $83,050 for business operations specialists, all other, through $105,850 for computer systems analysts, $120,230 for data scientists and $126,760 for database administrators and architects (BLS Occupational Outlook Handbook, May 2025). Within the last, database architects had a median of $139,500, with the lowest 10 percent under $86,240 and the highest 10 percent over $204,000. Data scientists ranged from under $67,240 to over $199,130 in the same cycle (BLS, May 2025).
The spread inside each occupation is wider than the gap between them, and most of it is industry and scope. For data scientists, publishing, broadcasting and content providers paid a median of $142,240 against $108,650 in insurance carriers (BLS, May 2025).
What a resume can move is which bracket you are read into on the first pass. Modeling and semantic layer ownership reads as engineering. Certified definitions and a change process read as governance. Dashboard production alone reads as reporting, the lowest of the four brackets. Write the first two.
Key takeaways for a business intelligence resume
- Name the warehouse, transformation, orchestration, semantic and visualization layers separately.
- Give model counts with the number of source systems and the row scale.
- Write one certified metric definition out in full, including what it excludes.
- Name the business owner of a metric, because that is what proves it is governed.
- Publish the change log: changes made, requests declined, what a request must contain.
- Count the competing measures you deprecated, which is the part that takes a year.
- Report weekly active users and self-serve share, never a bare dashboard count.
- Give a before and after for refresh time and for warehouse cost.
Build your business intelligence resume in 15 minutes with our AI resume builder.
Related business and management resume examples
- Business analyst resume
- Senior business analyst resume
- Entry level business analyst resume
- Product owner resume
- Product manager resume
- Project manager resume
- Program manager resume
- Consultant resume
- Consulting resume
- Supply chain analyst resume
- Internal auditor resume
- Business management resume
Pair it with a matching business intelligence cover letter.
Business intelligence resume questions, answered
How long should a business intelligence resume be?
One page for your first three years, two once you own a model other teams build on. The second page should be the platform block and the metric layer, not a longer list of dashboards.
Should I list every dashboard I have built?
No. A dashboard count is unreadable because it carries no denominator and no usage. Replace it with three numbers a reader can interpret: how many datasets or models you publish, how many people open them weekly, and what share of reporting requests the self-serve layer now answers without you.
What do I put on a business intelligence resume with no business intelligence title?
Whatever platform evidence your previous role produced. Analysts have reports rebuilt and definitions agreed; finance staff have spreadsheet extracts retired and close reporting automated; operations staff have manual steps removed and hours returned. Then name the stack you have actually worked in and the layer you touched, and be exact about which.
Can I show dashboards from my current job in a portfolio?
Not with real data in them. Sales figures, customer records, headcount and margin are your employer's information, and a screenshot in a public portfolio is a disclosure. Rebuild the layout on a public dataset, say so, and describe the original by shape rather than by content.
How do I prove a metric definition mattered?
By what it replaced and who signed it. "Agreed a single definition of net sales with the finance controller, retired two competing versions, one of which ran about 3 percent high, and mapped 61 report-level measures to the certified equivalent" is an argument that finished. A definition nobody disagreed with beforehand was never load-bearing.